Conversion Rate Optimization

At Homemakers Furniture I design the A/B tests we run with our CRO specialist and developers. These are the ones that performed best: what we saw in the data, what I changed, and what happened.

Single-Column Shipping Form

Desktop checkout, February to March 2026

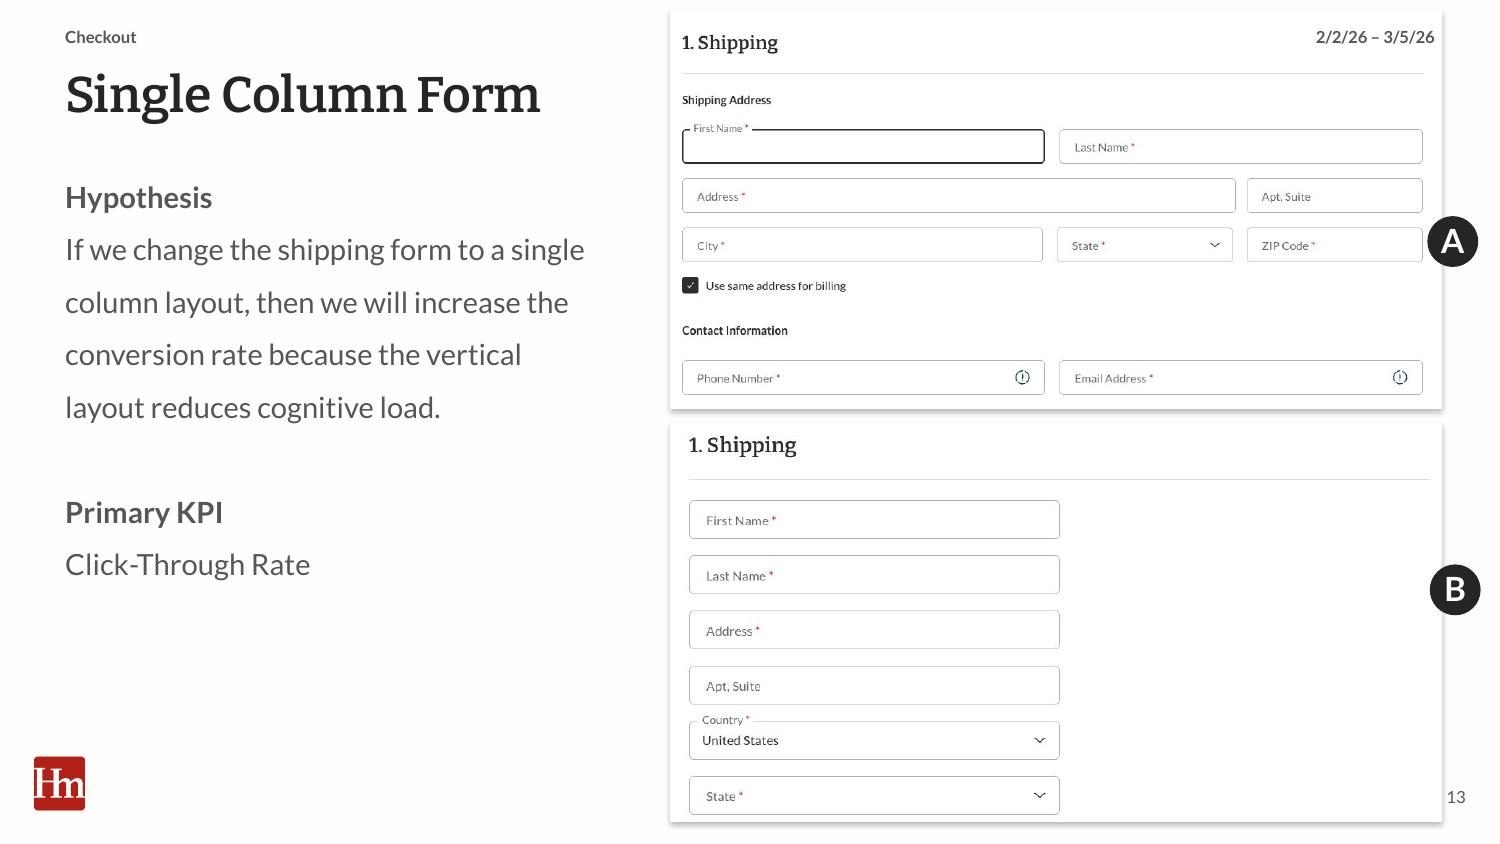
Our shipping form split its fields across two columns. It looked compact, but it made the first step of checkout slower to scan and easier to get wrong. I moved the same fields into a single column and tested it against the original.

Clarity recordings showed people getting through the step 1 to 2 minutes faster, and skipped fields mostly went away.
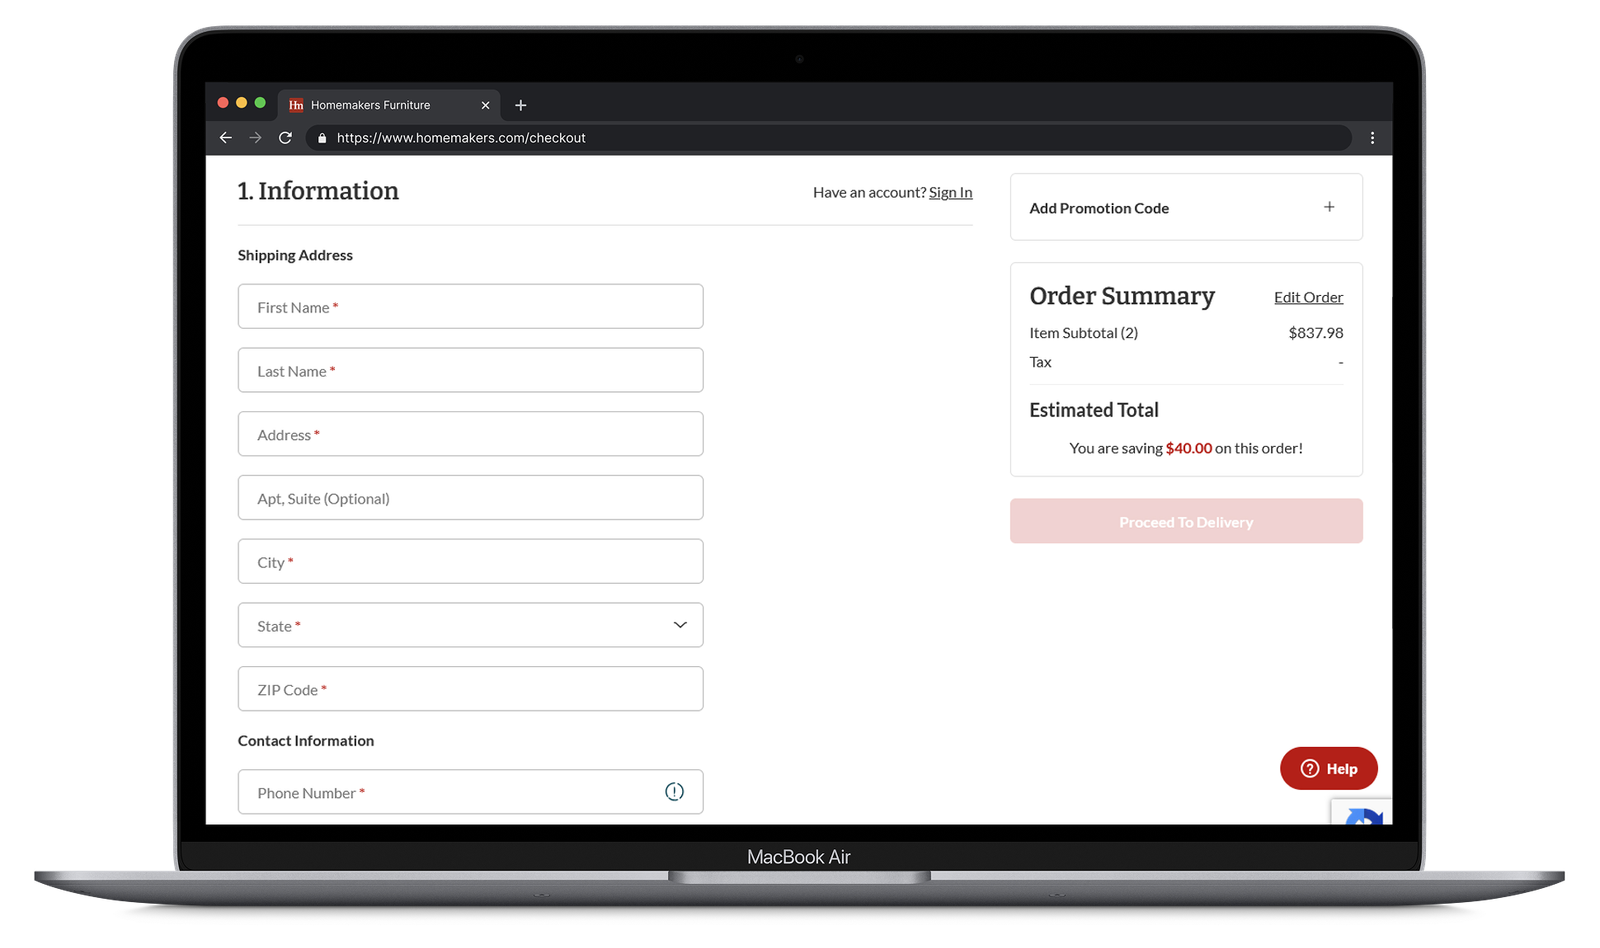
MacBook mockup of the single-column checkout shipping form (variant)

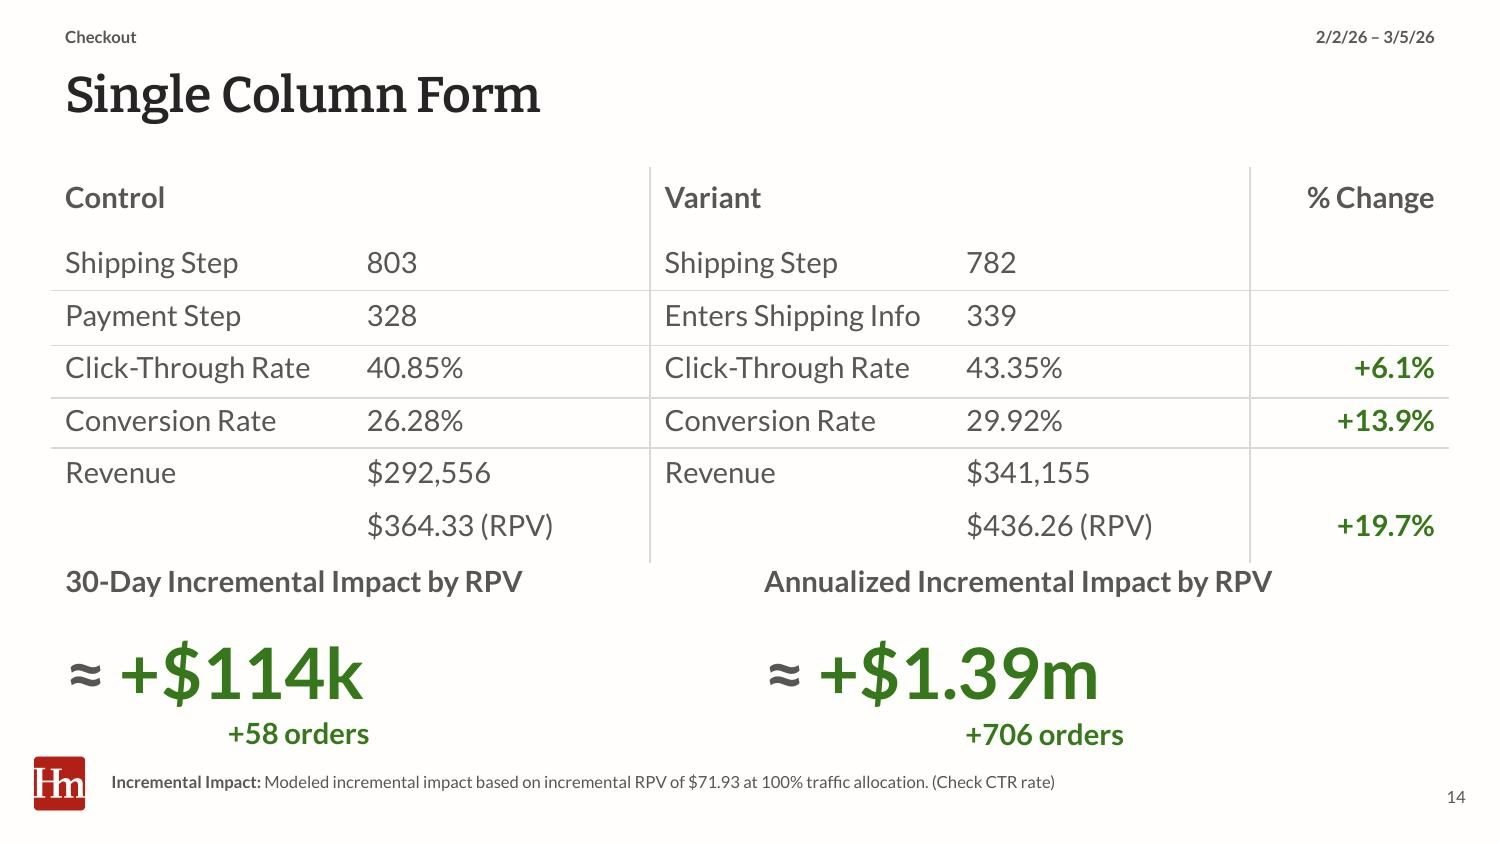
+13.88%

conversion rate, at 94.7% confidence

+6.1%

more shoppers reaching the payment step (from 40.85%)

+$999k

projected annual incremental revenue

iPhone mockup of the restructured buy block on the Bernhardt Antibes Cream King Bed product page

Buy Block Positioning

Mobile product pages, May to June 2024

Product pages got plenty of engagement but converted below what the traffic suggested. Price, availability and key details were spread out or buried in one long block of text, so I reordered the buy block around what shoppers decide on first.

Conversion and bounce rate held flat. The lift showed up as purchase intent rather than completed orders.

+13.1%

add to cart clicks, at 99% confidence

+$1.05m

projected annual incremental revenue

Persistent Add to Cart

Mobile product pages, January to February 2024

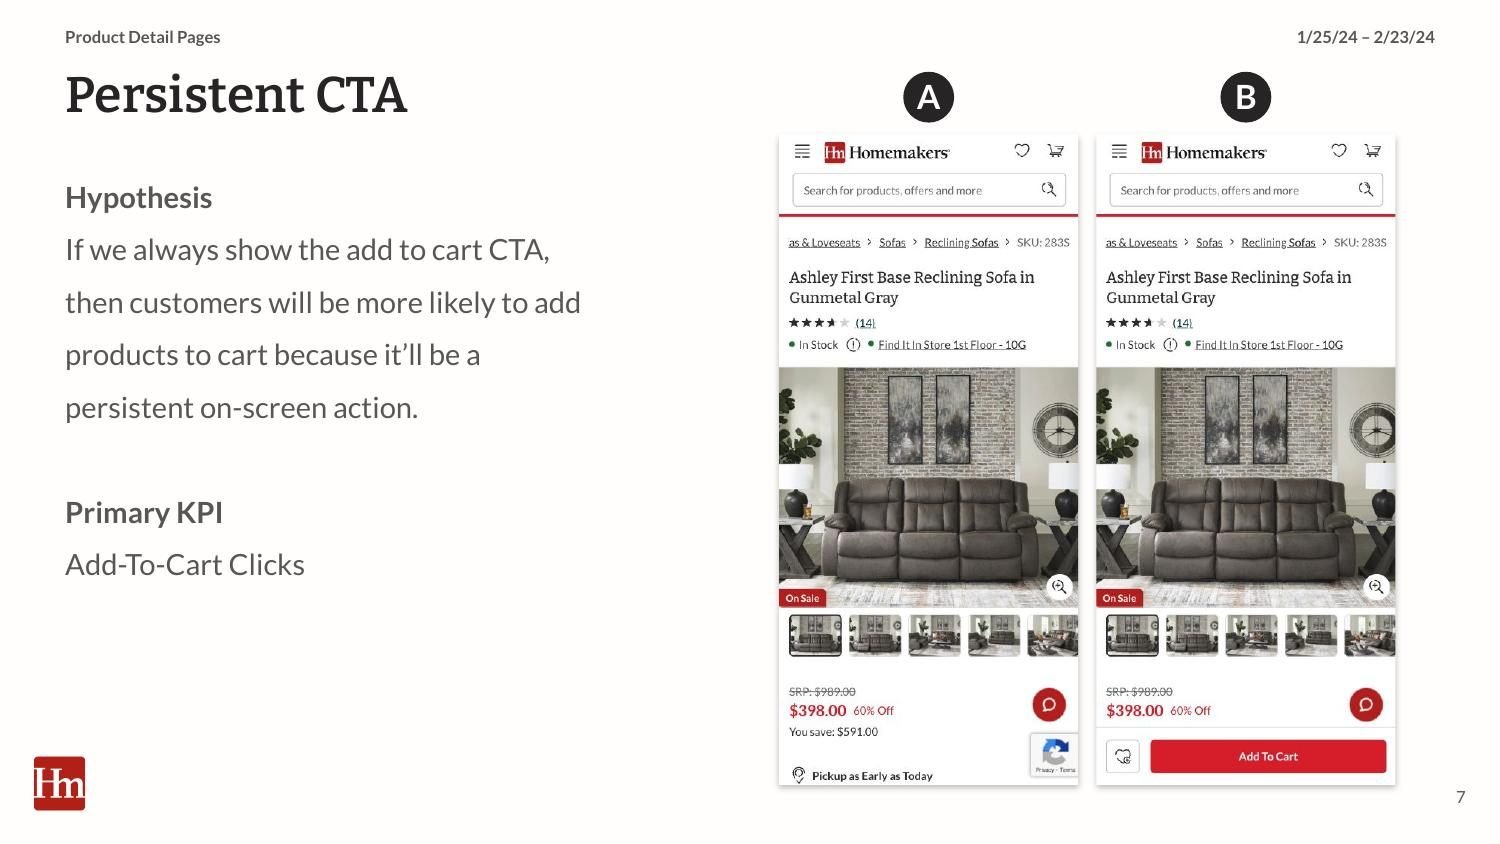
On long mobile product pages, Add to Cart scrolled out of view while people read specs and reviews. Getting back to it meant scrolling all the way up, so I made it sticky.

The bigger surprise was wishlists. Furniture is a slow purchase, and a lot of shoppers saved items for later instead of buying on the spot.

iPhone mockup of the sticky Add to Cart button on the Ashley Altari Slate Sofa product page

+6%

add to cart clicks, at 95% confidence

+48%

wishlist clicks, at 95% confidence

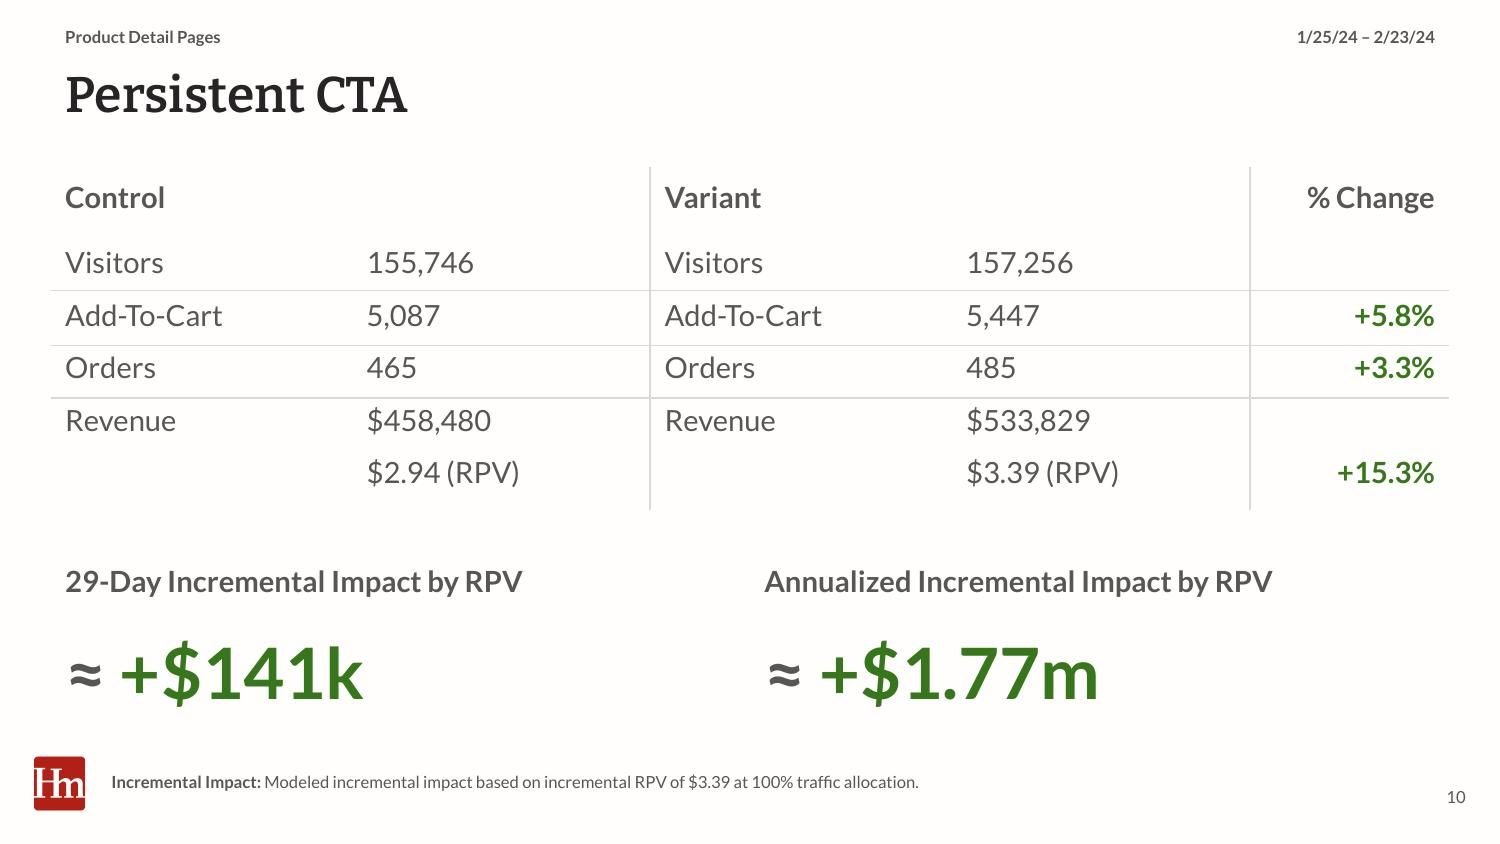
+$141k

incremental revenue if shown to all traffic during the test

Conversion Rate Optimization Executive Summary

I had the opportunity to present my conversion rate optimization (CRO) tests and findings to the executive and business strategy teams. Not only was it an opportunity to share the great results that the tests were yielding, but also a chance to explain why testing at scale is such an important lever for an ecommerce site. You can view and download the PDF presentation.
CRO summary title slide: Conversion Rate Optimization, A/B testing as a revenue and risk lever
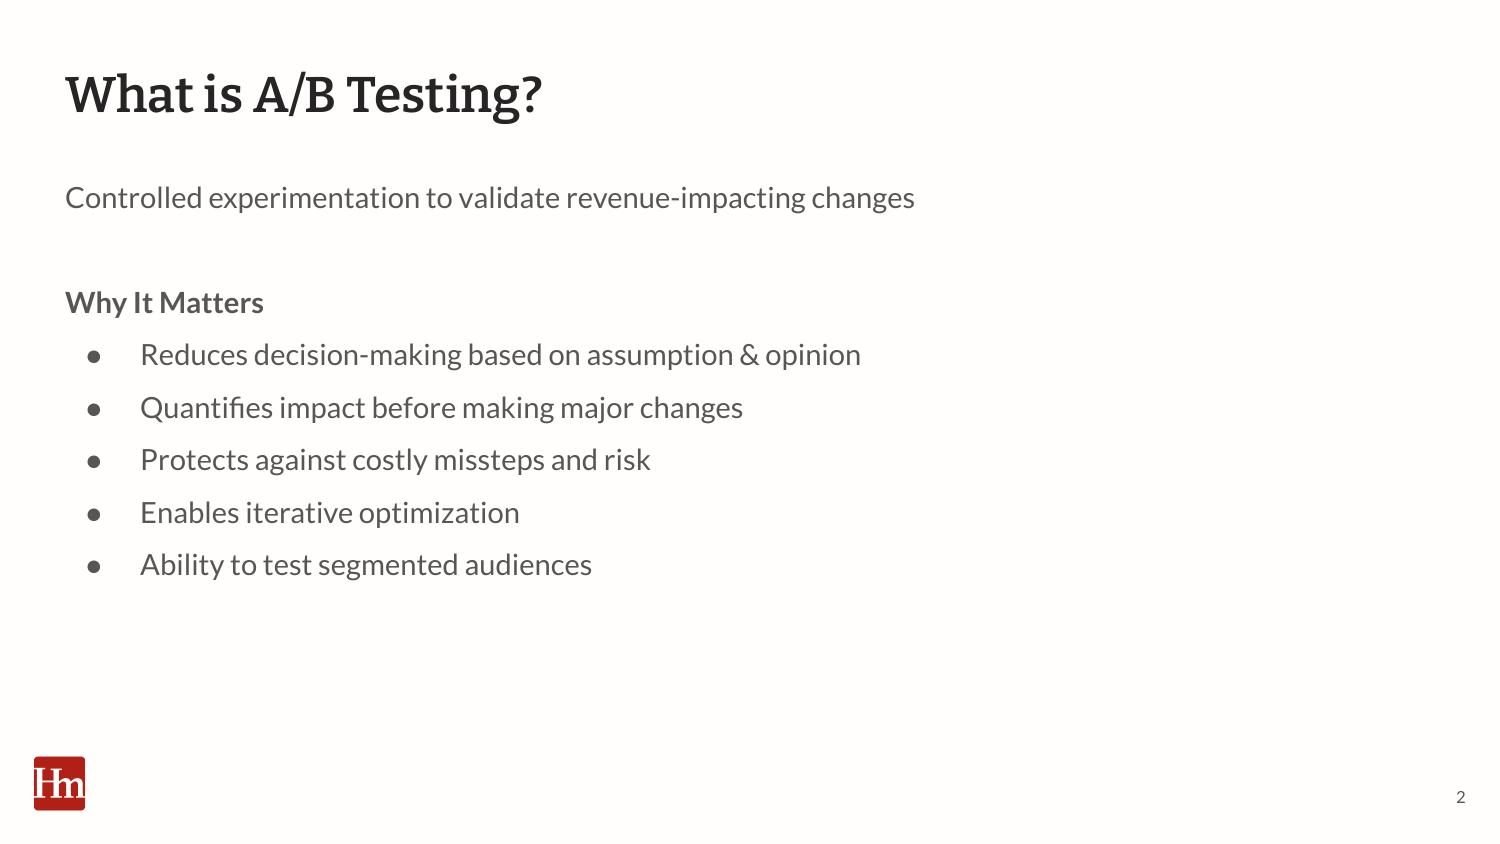
CRO summary slide: What is A/B testing? A controlled experiment to validate revenue impact of changes, with reasons why it matters
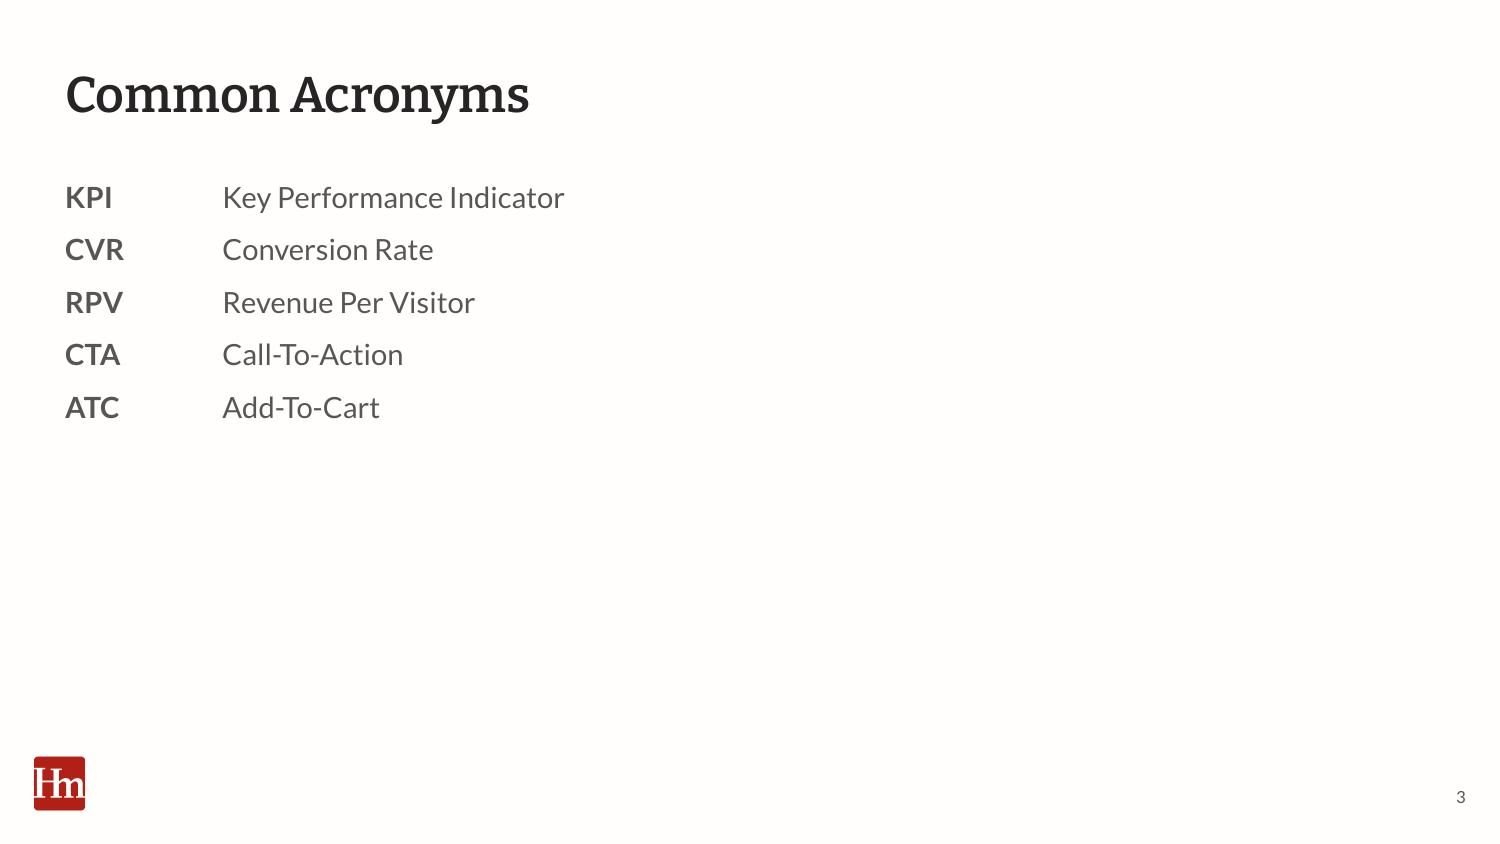
CRO summary slide: Common acronyms – KPI, CVR, RPV, CTA and ATC defined
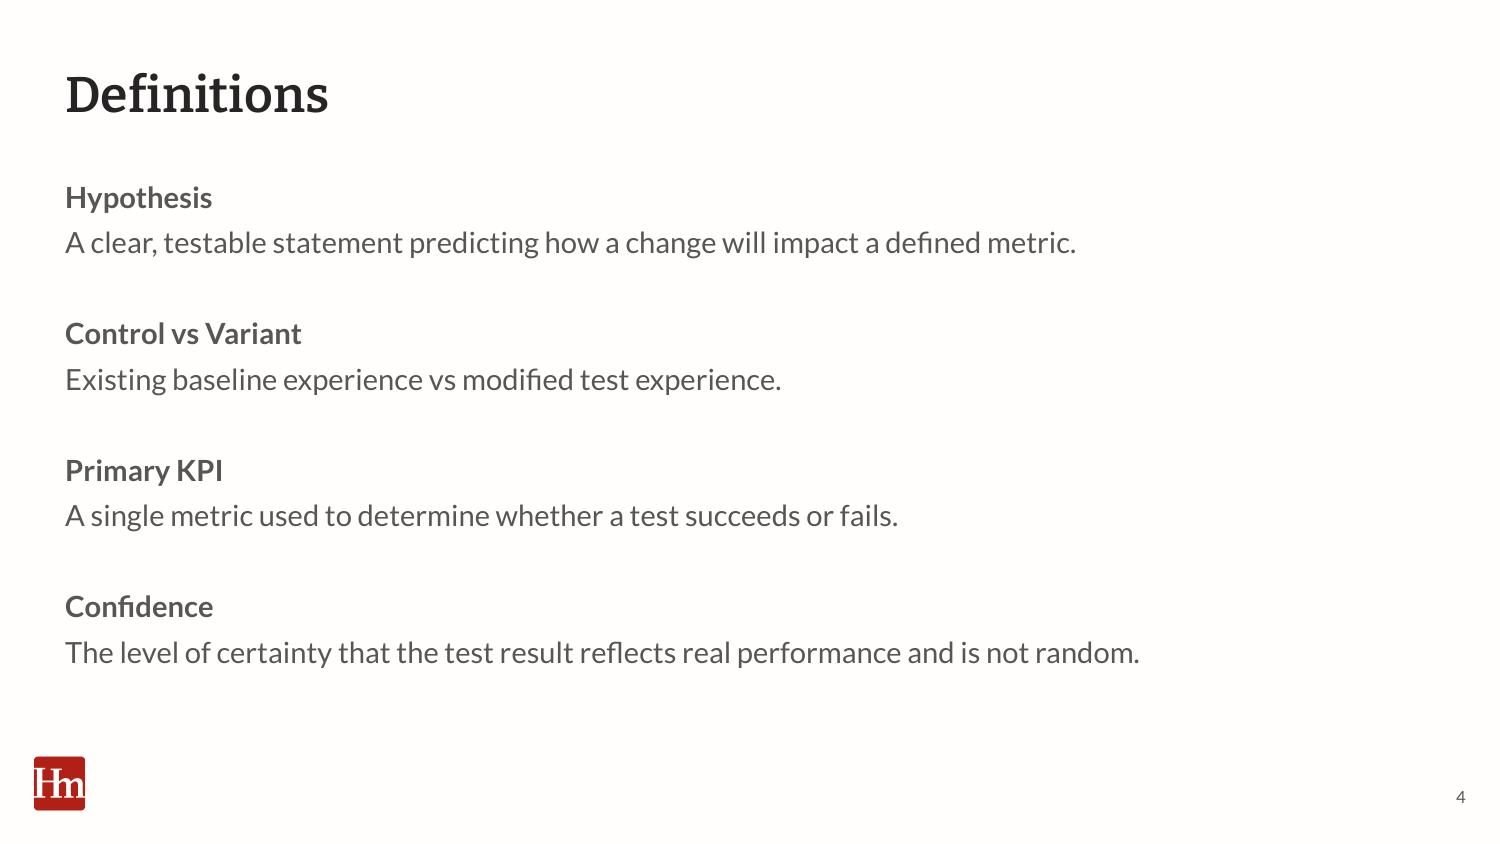
CRO summary slide: Definitions of hypothesis, control vs. variant, primary KPI and confidence
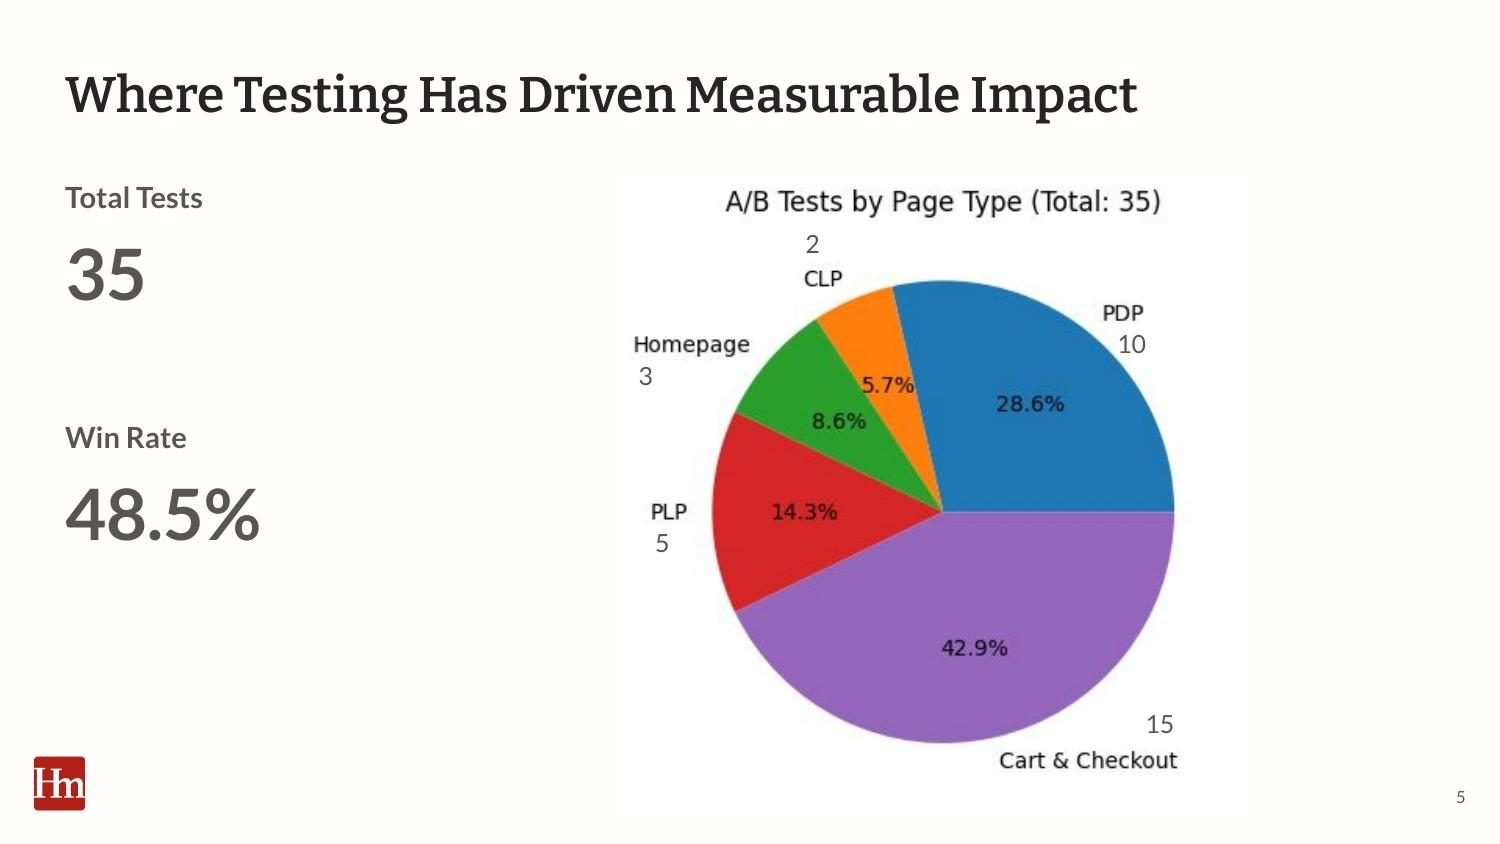
CRO summary slide: Where testing has driven measurable impact, 35 total tests with a 48.5% win rate, pie chart of tests by page type
CRO summary section divider: Examples of successful tests
CRO summary slide: Persistent CTA test hypothesis with control and variant mobile product page screenshots
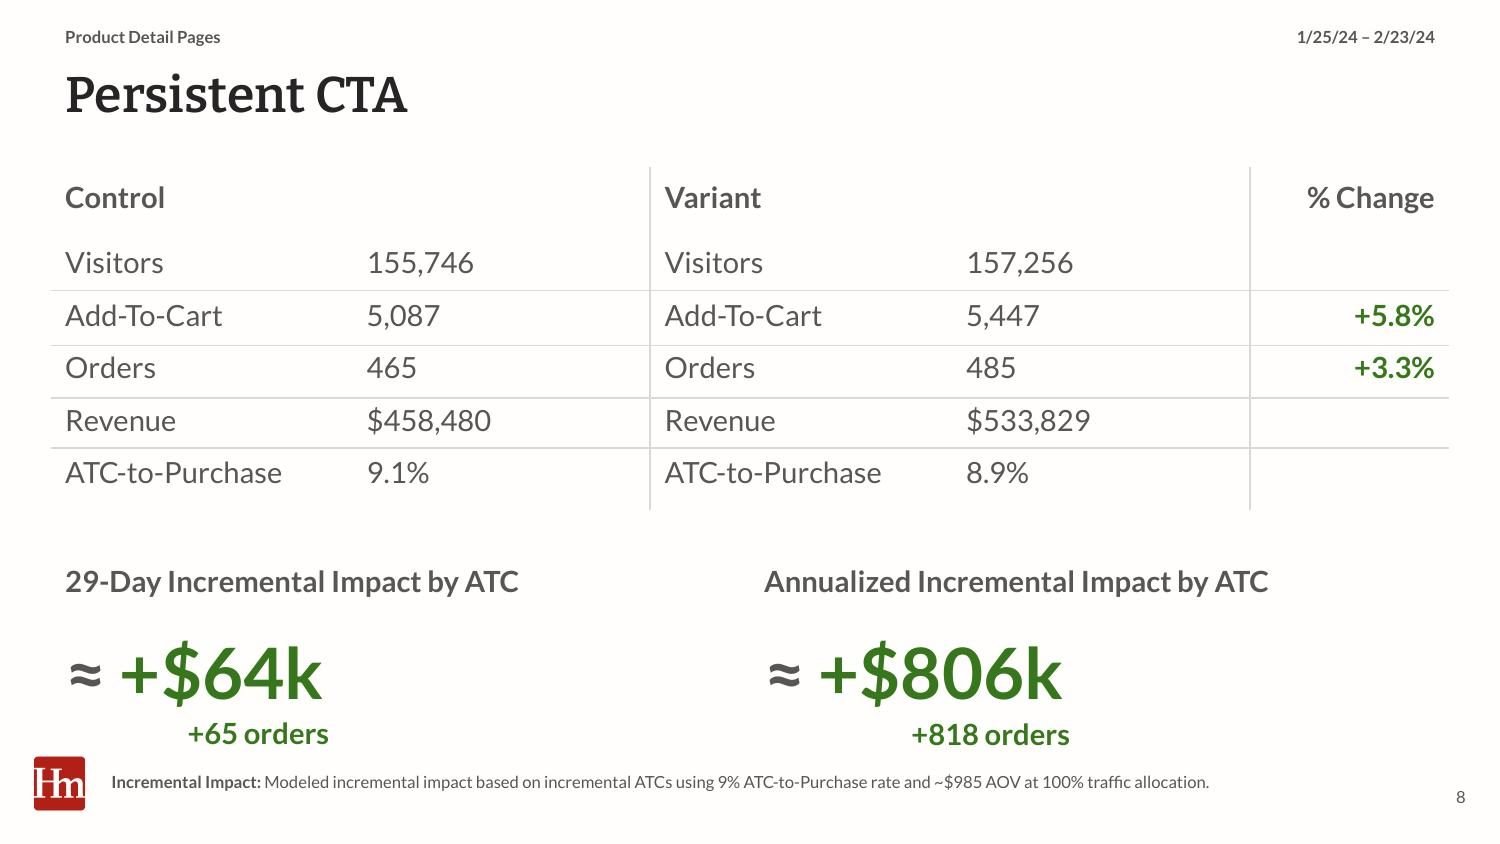
CRO summary slide: Persistent CTA results by add-to-cart rate, about +$64k over 21 days and +$806k annualized
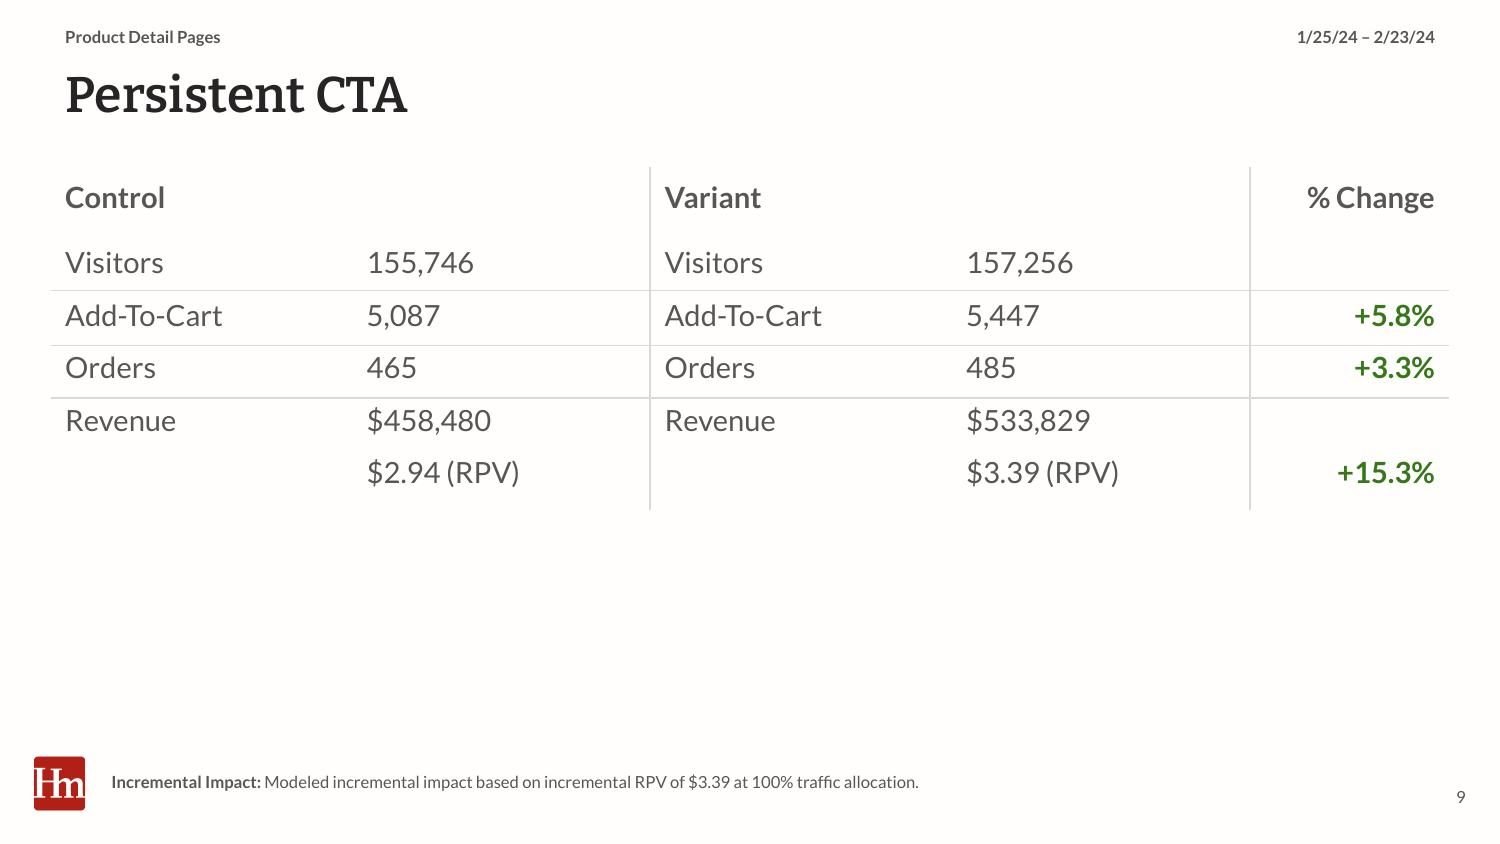
CRO summary slide: Persistent CTA test results table comparing control and variant visitors, add-to-carts, orders and revenue
CRO summary slide: Persistent CTA results by revenue per visitor, about +$141k over 21 days and +$1.77M annualized
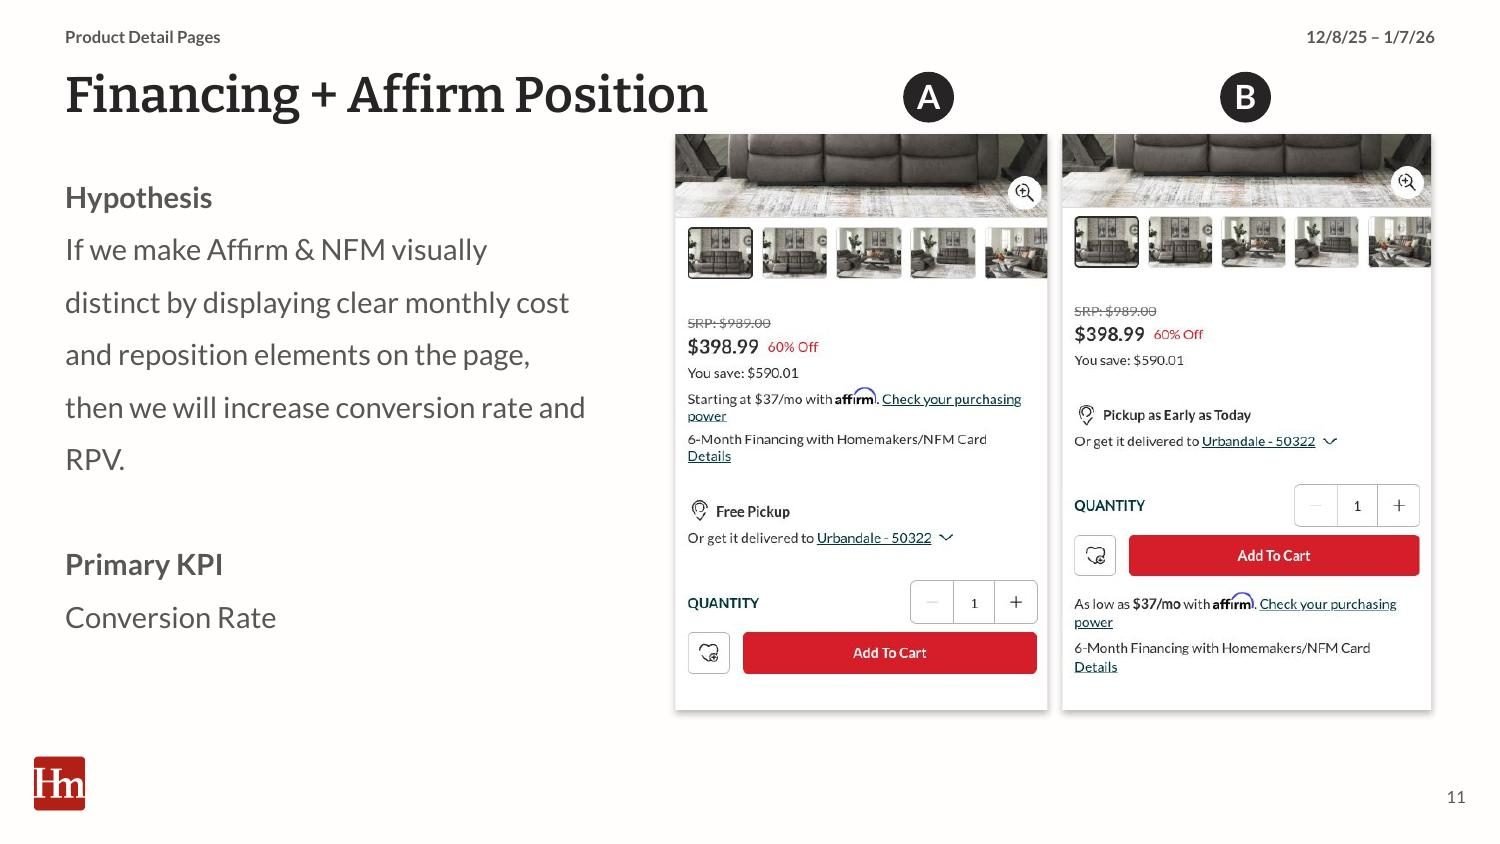
CRO summary slide: Financing and Affirm Position test hypothesis with control and variant product page screenshots
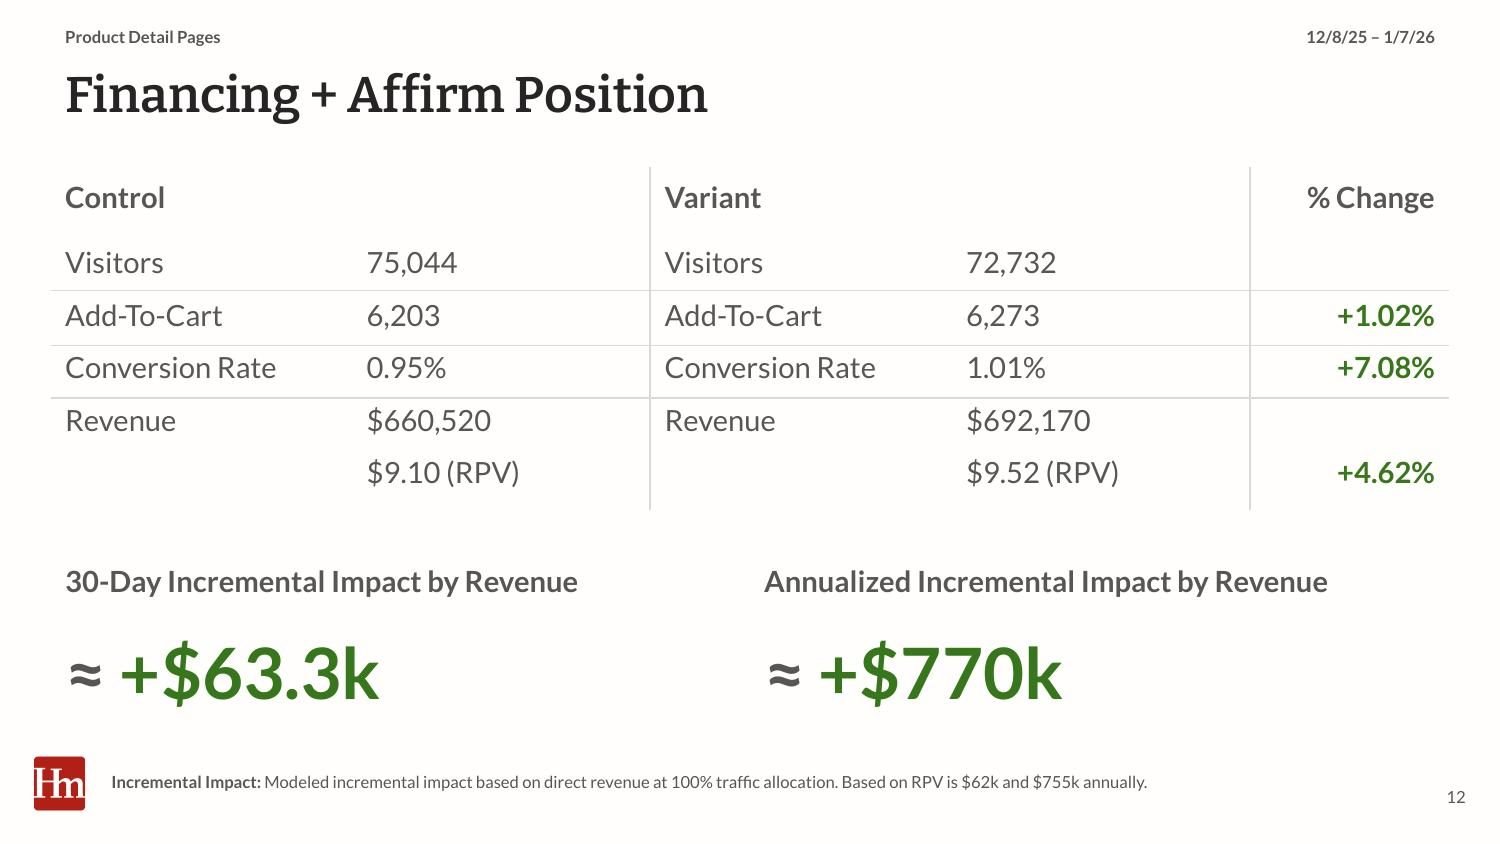
CRO summary slide: Financing and Affirm Position test results, about +$63.3k over 30 days and +$770k annualized
CRO summary slide: Single Column Form test hypothesis with multi-column and single-column checkout shipping forms
CRO summary slide: Single Column Form test results, about +$114k over 21 days and +$1.39M annualized
CRO summary section divider: Example of a failed test
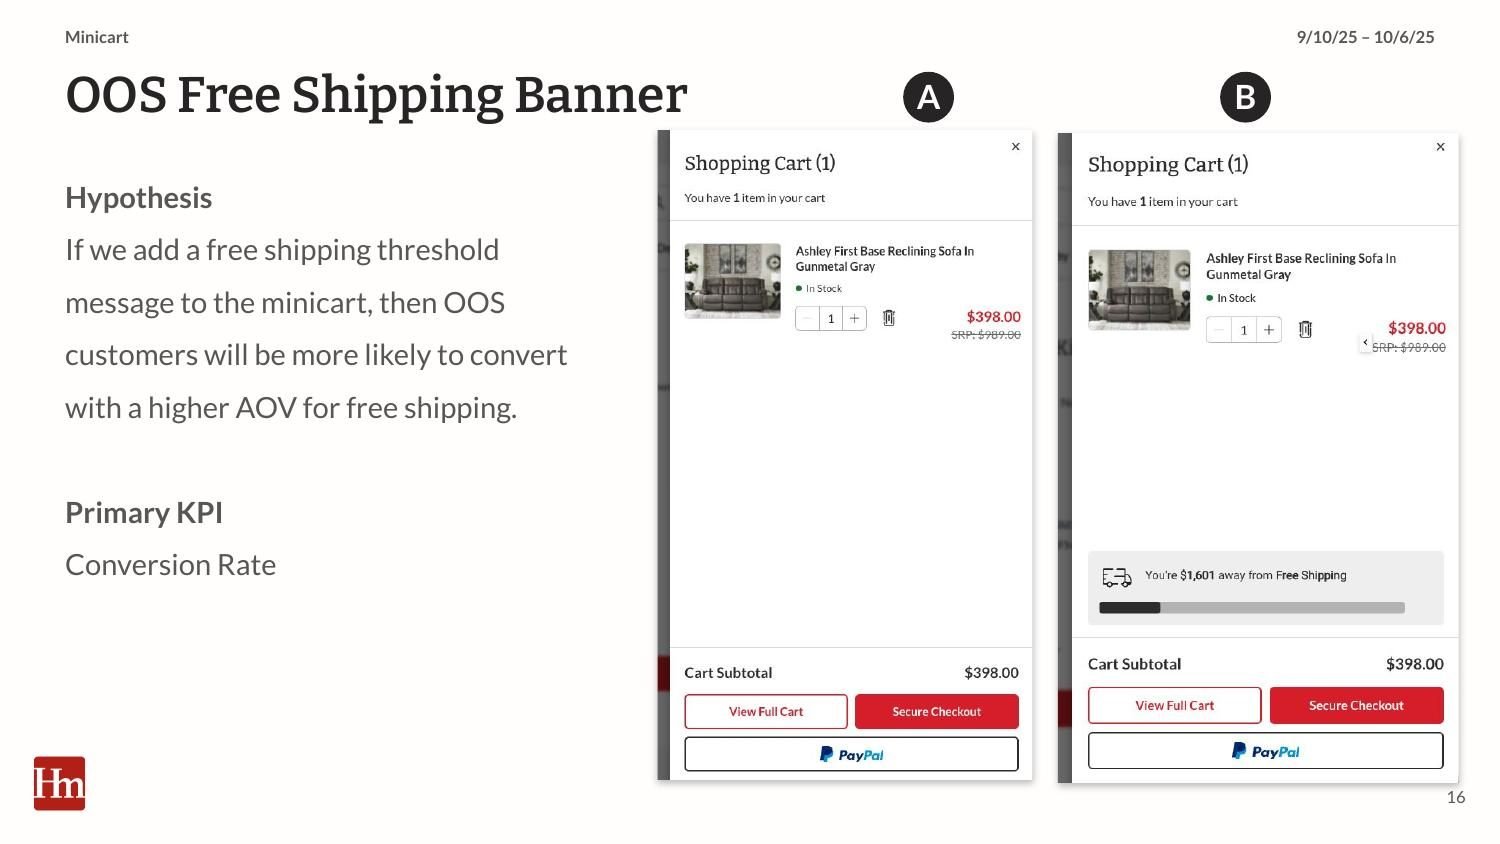
CRO summary slide: OOS Free Shipping Banner test hypothesis with control and variant product page screenshots
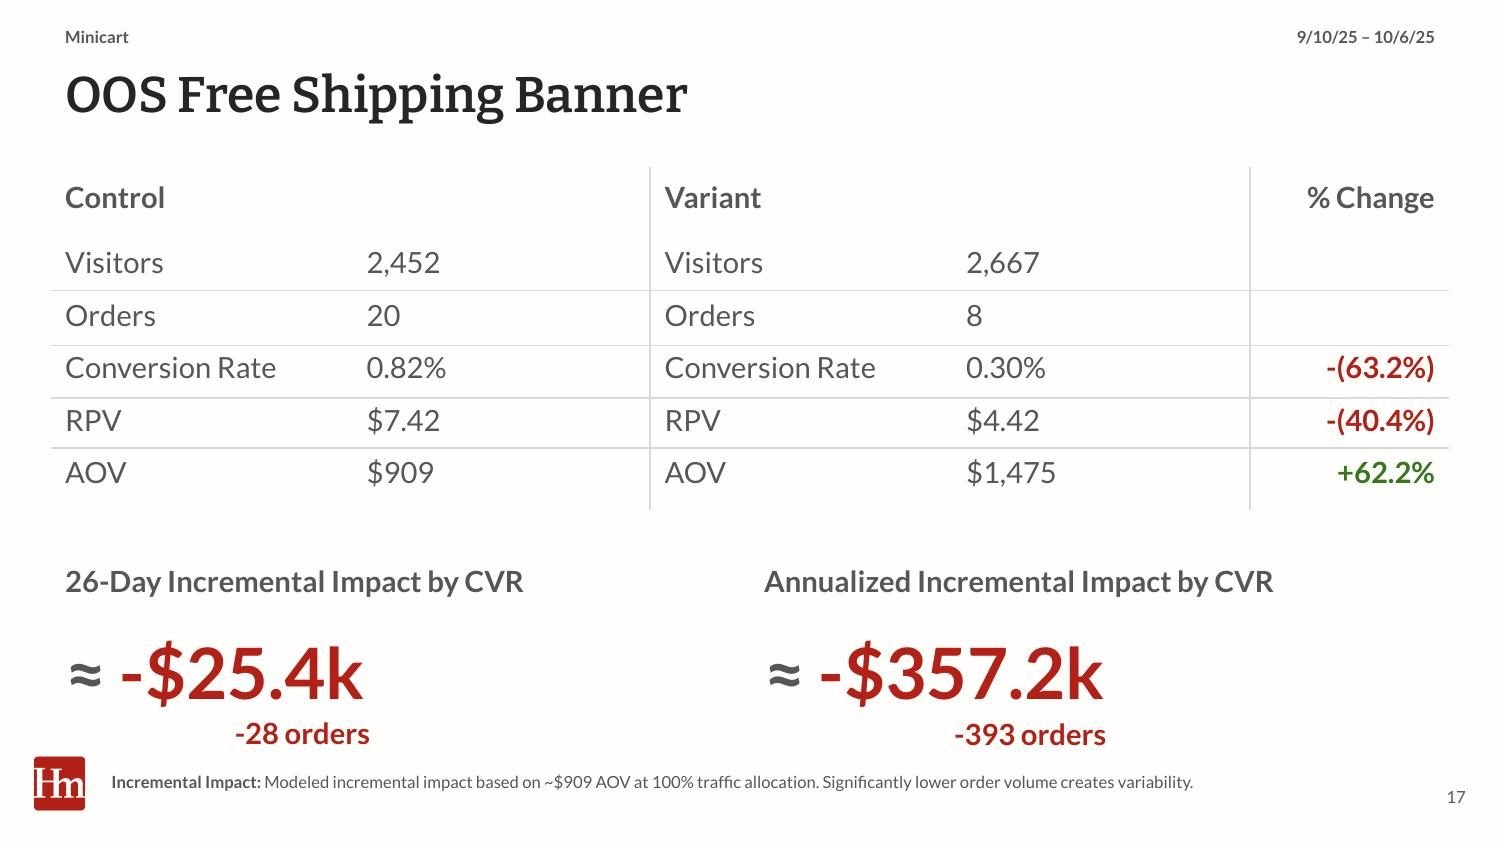
CRO summary slide: OOS Free Shipping Banner test results showing a negative impact of about -$25.4k over 21 days and -$357.2k annualized
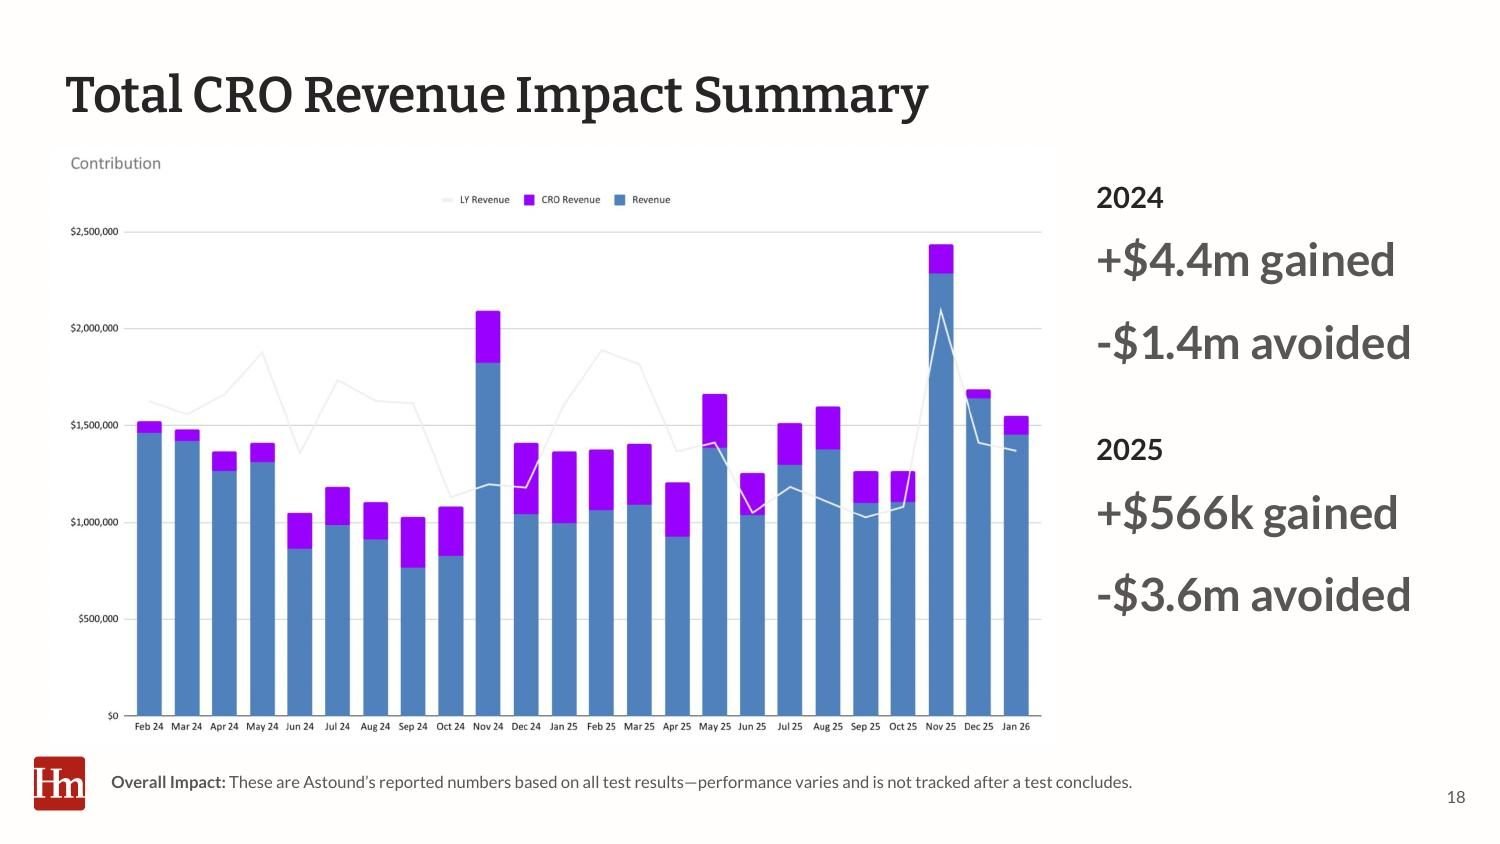
CRO summary slide: Total CRO revenue impact bar chart showing $4.4M gained and $1.4M avoided in 2024, and $566k gained and $3.6M avoided in 2025
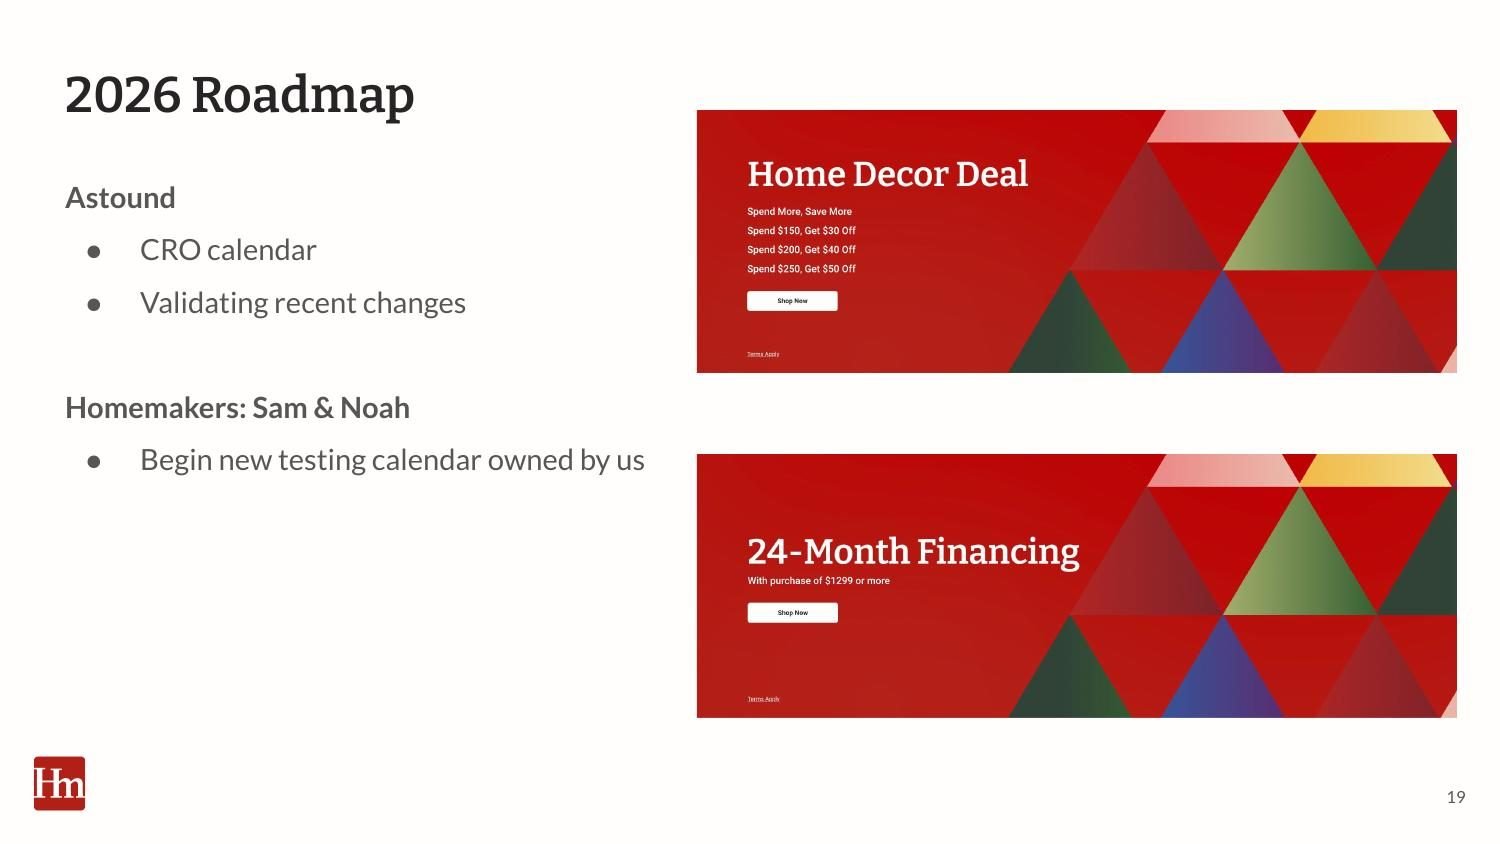
CRO summary slide: 2026 roadmap listing CRO planning and Homemakers test and hook ideas with promotional banner examples
CRO summary slide: Thank you, questions?