Conversion Rate Optimization Executive Summary

I had the opportunity to present my conversion rate optimization (CRO) tests and findings to the executive and business strategy teams. Not only was it an opportunity to share the great results that the tests were yielding, but also a chance to explain why testing at scale is such an important lever for an ecommerce site. You can view and download the PDF presentation.
CRO summary title slide: Conversion Rate Optimization, A/B testing as a revenue and risk lever
CRO summary slide: What is A/B testing? A controlled experiment to validate revenue impact of changes, with reasons why it matters
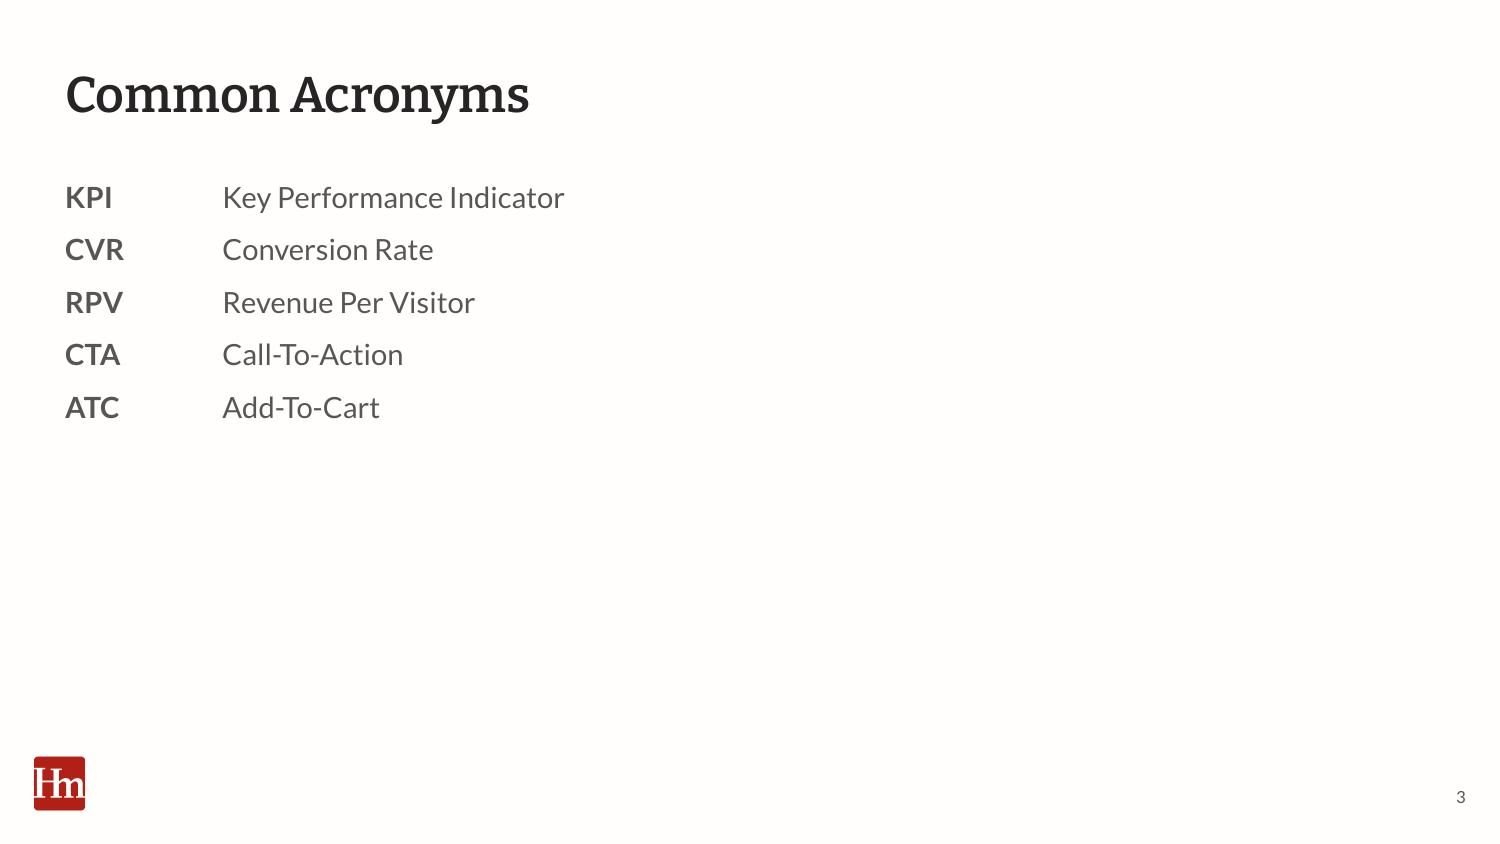
CRO summary slide: Common acronyms – KPI, CVR, RPV, CTA and ATC defined
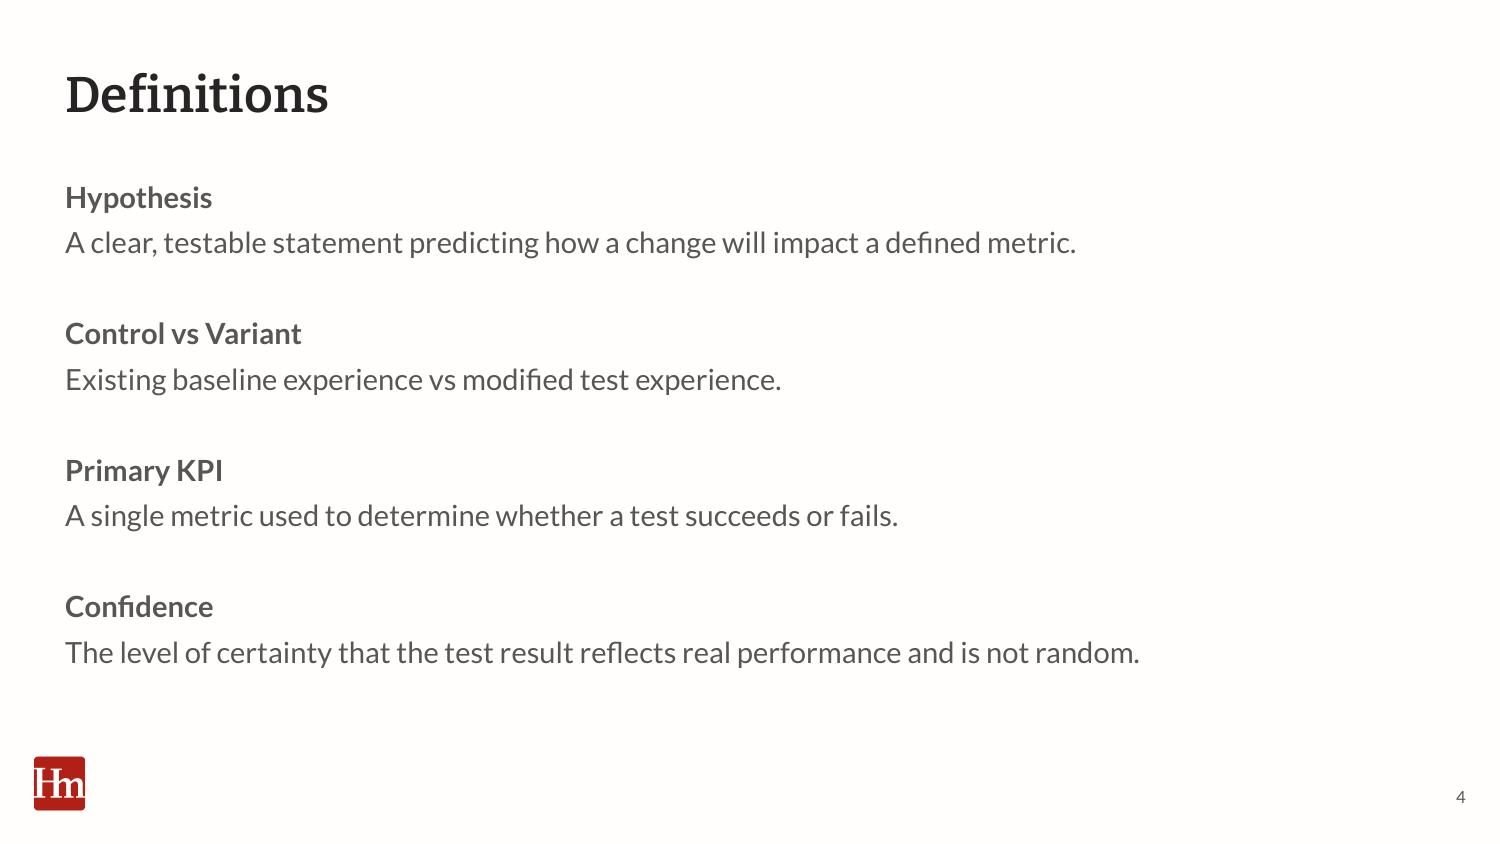
CRO summary slide: Definitions of hypothesis, control vs. variant, primary KPI and confidence
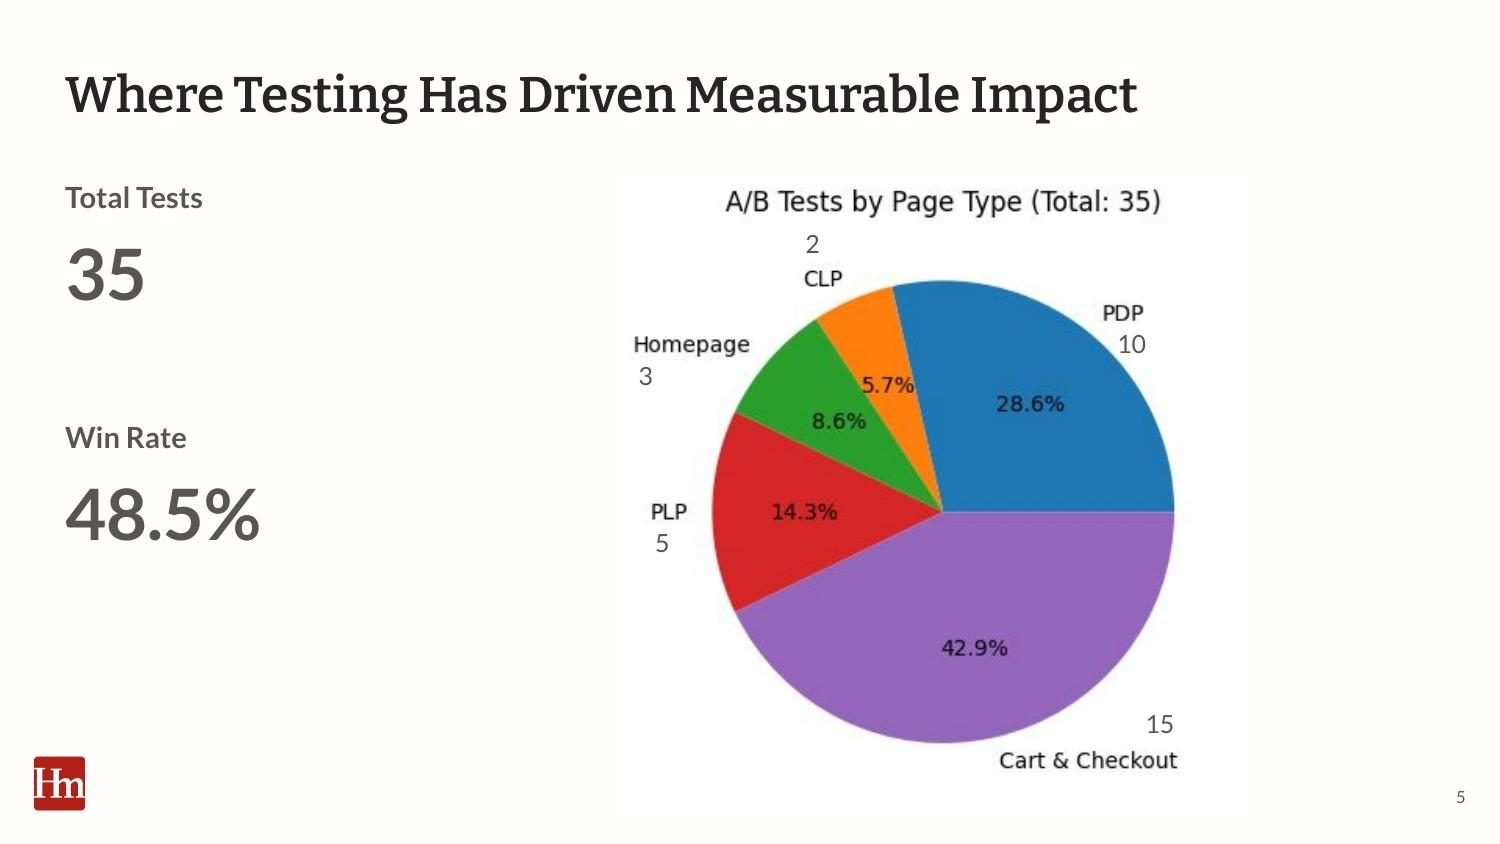
CRO summary slide: Where testing has driven measurable impact, 35 total tests with a 48.5% win rate, pie chart of tests by page type
CRO summary section divider: Examples of successful tests
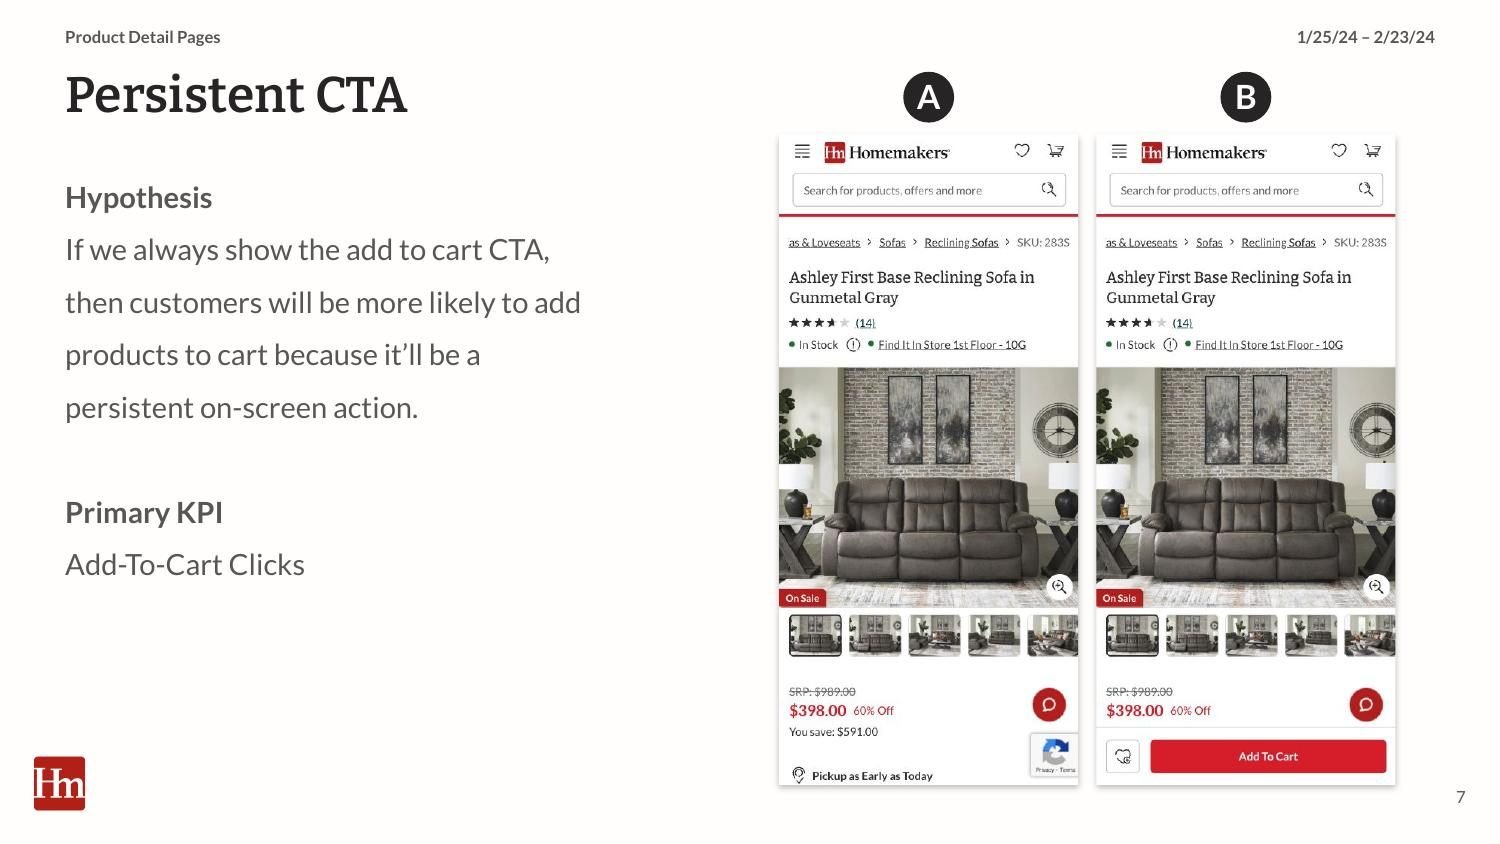
CRO summary slide: Persistent CTA test hypothesis with control and variant mobile product page screenshots
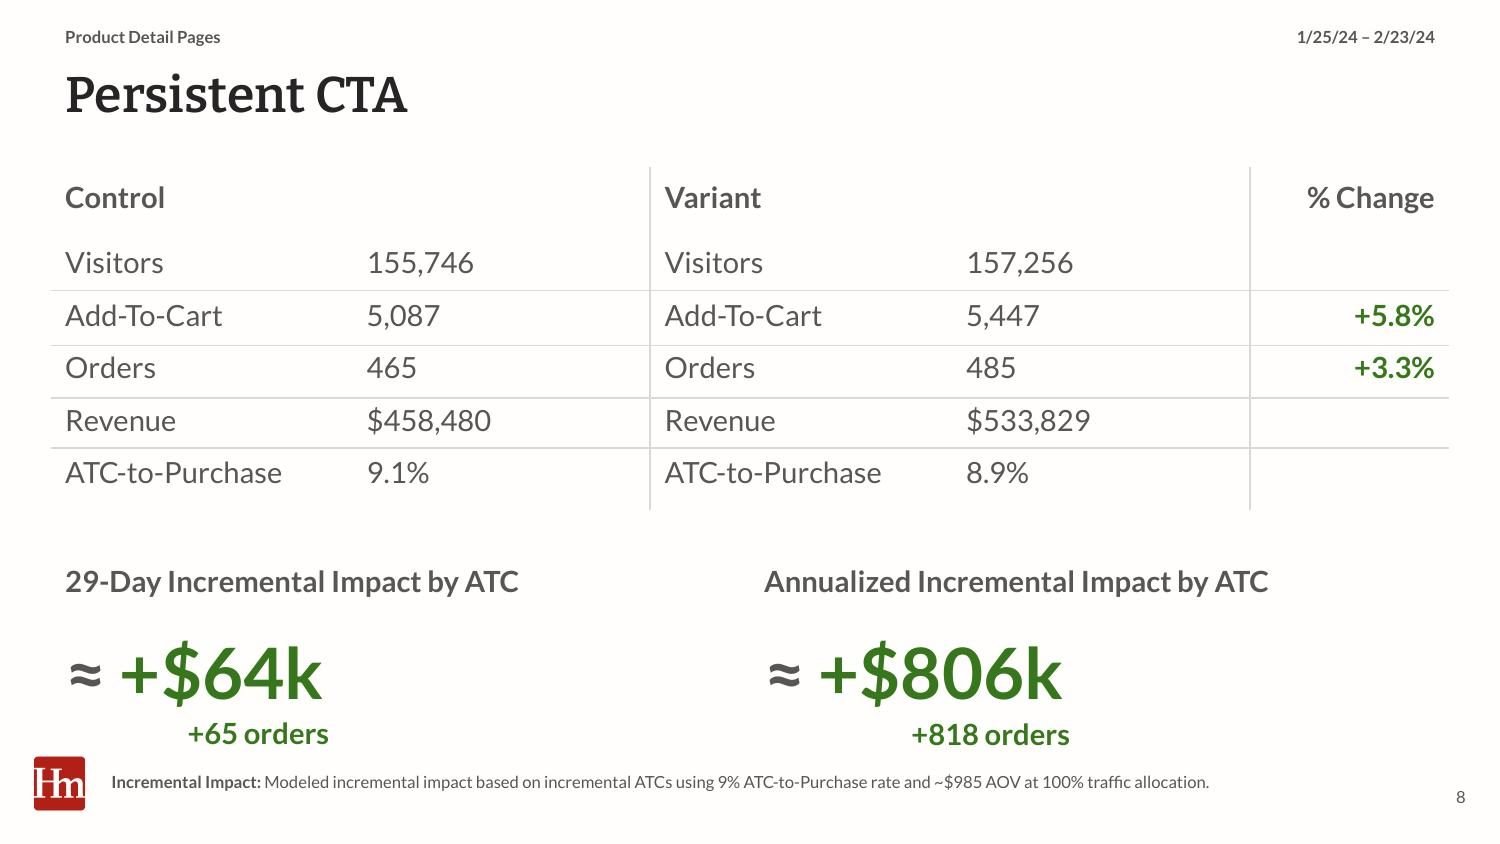
CRO summary slide: Persistent CTA results by add-to-cart rate, about +$64k over 21 days and +$806k annualized
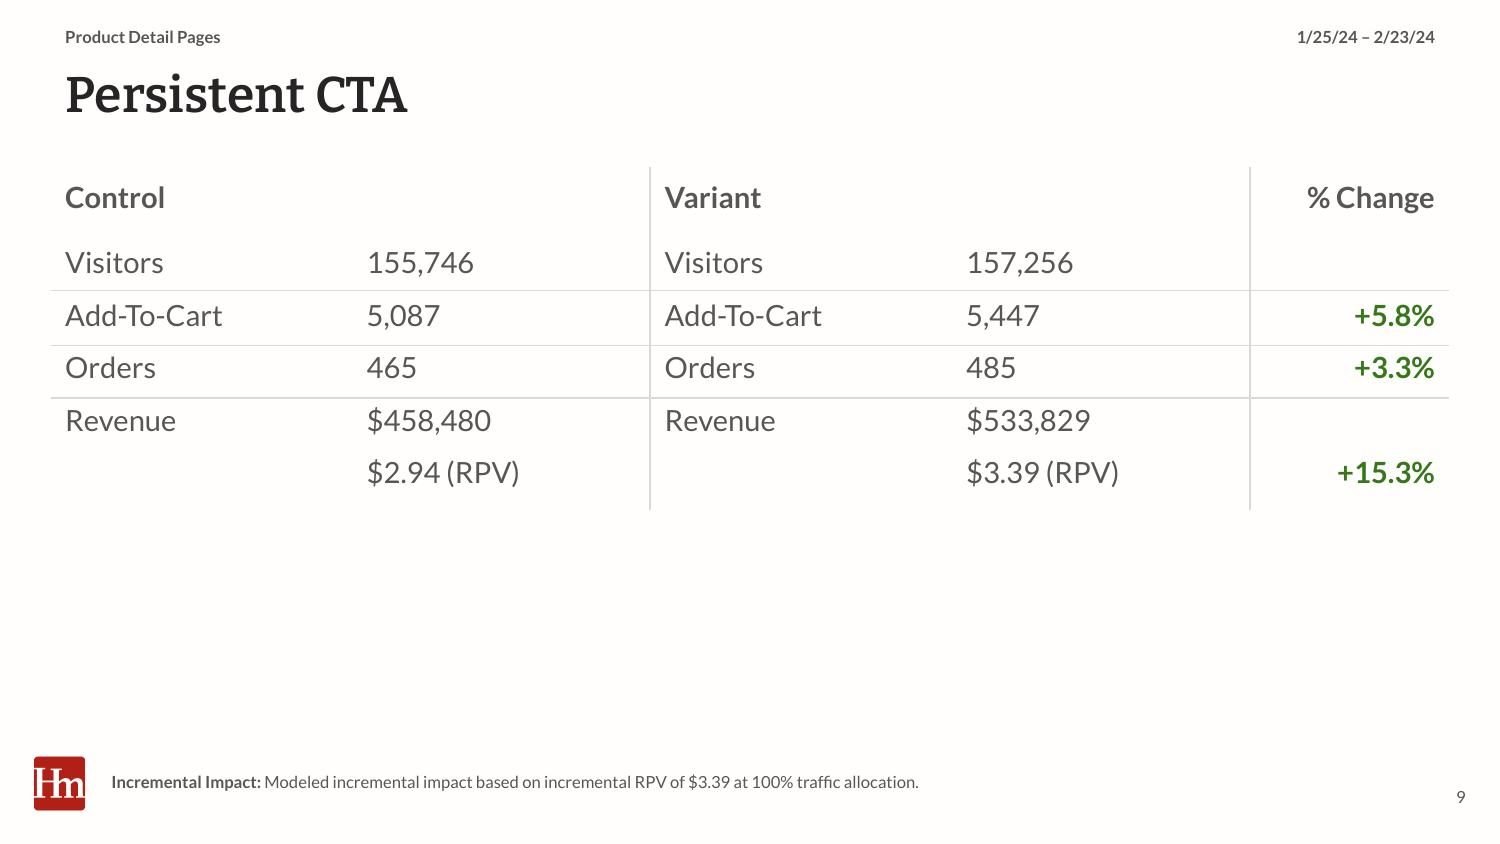
CRO summary slide: Persistent CTA test results table comparing control and variant visitors, add-to-carts, orders and revenue
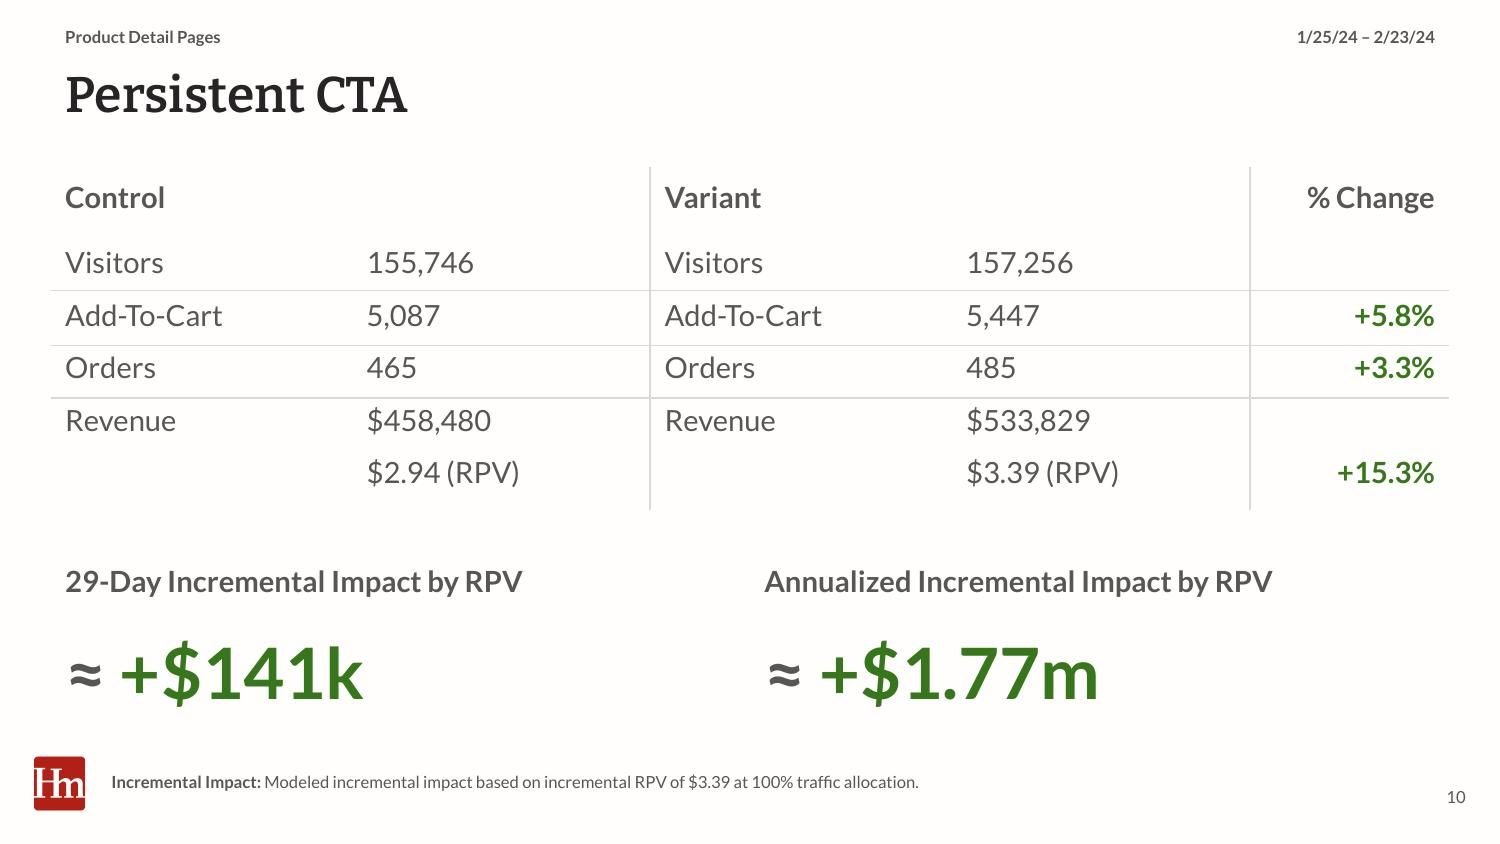
CRO summary slide: Persistent CTA results by revenue per visitor, about +$141k over 21 days and +$1.77M annualized
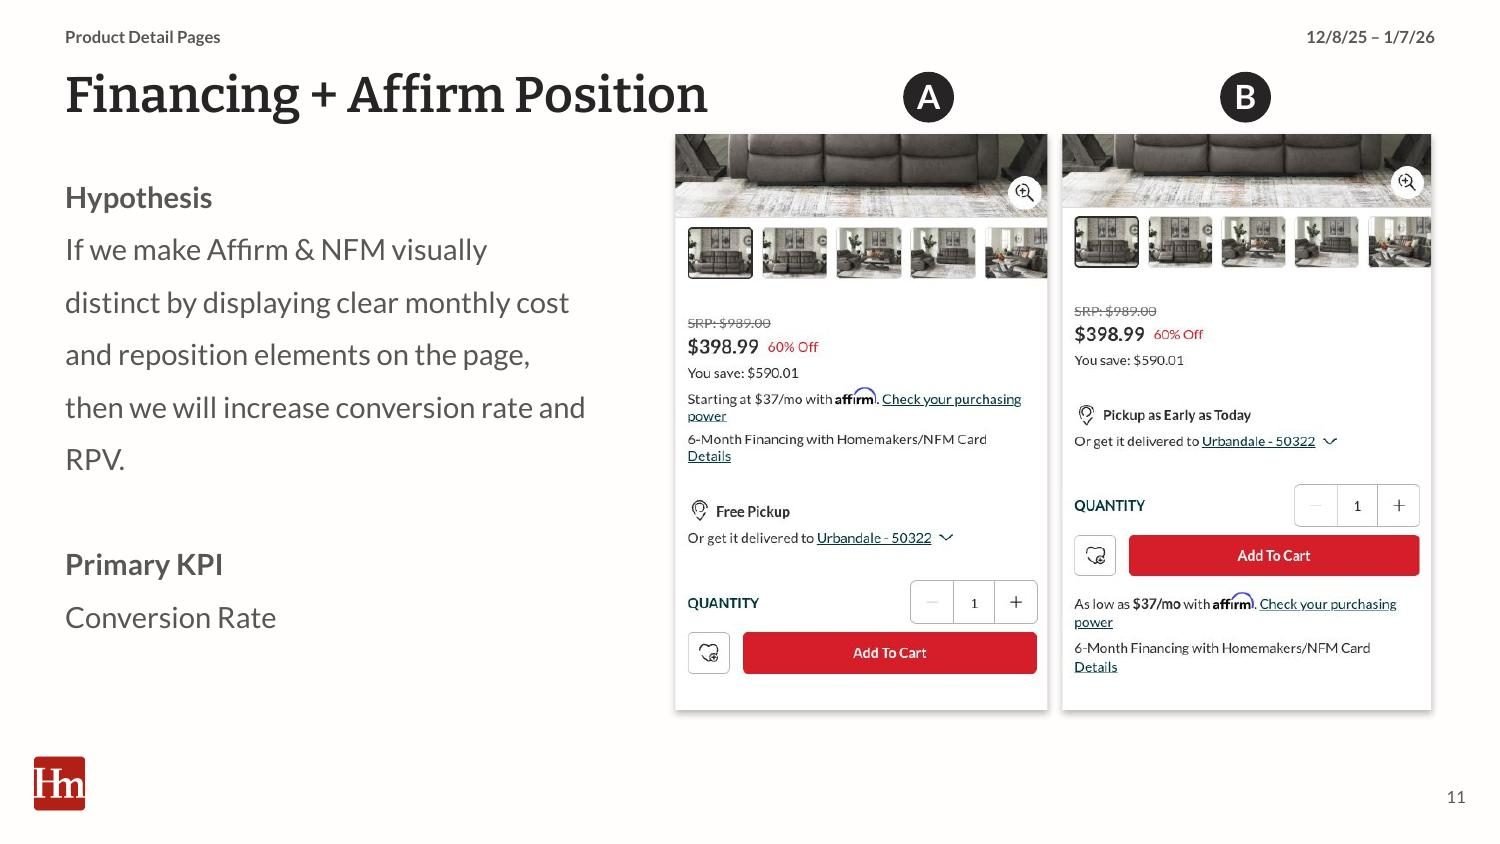
CRO summary slide: Financing and Affirm Position test hypothesis with control and variant product page screenshots
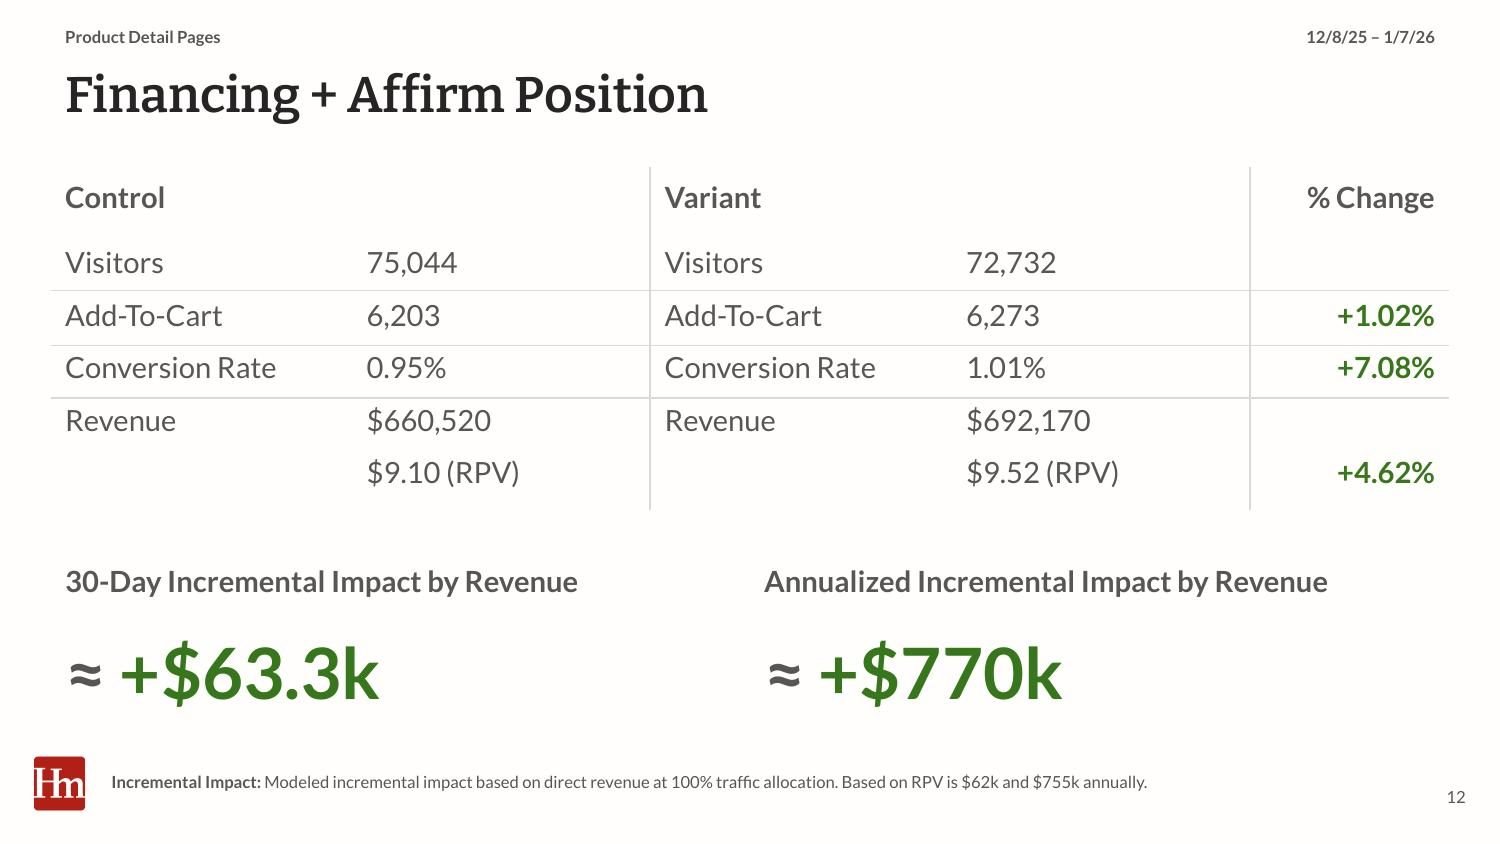
CRO summary slide: Financing and Affirm Position test results, about +$63.3k over 30 days and +$770k annualized
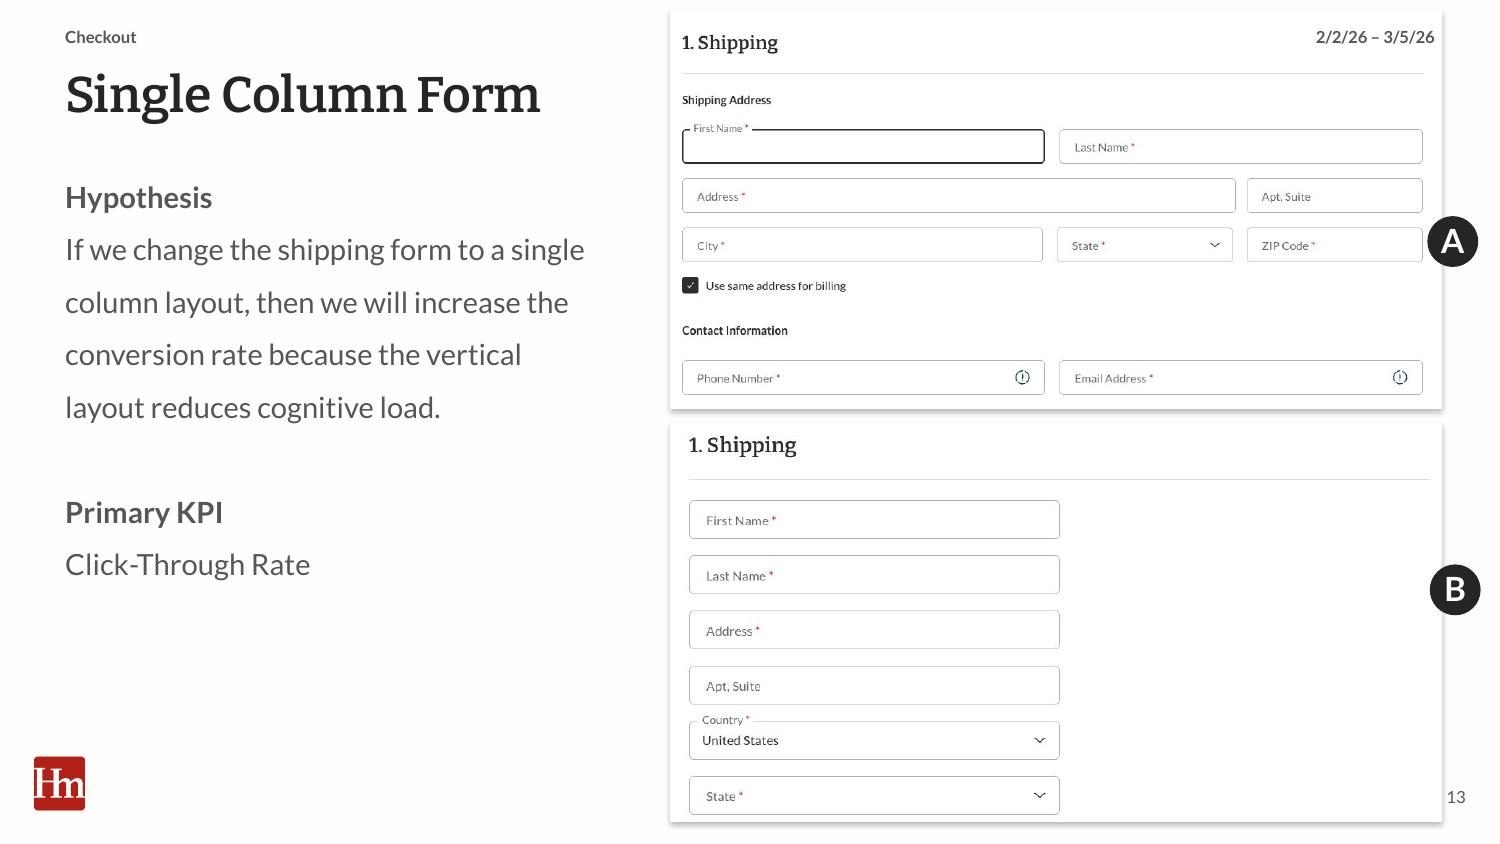
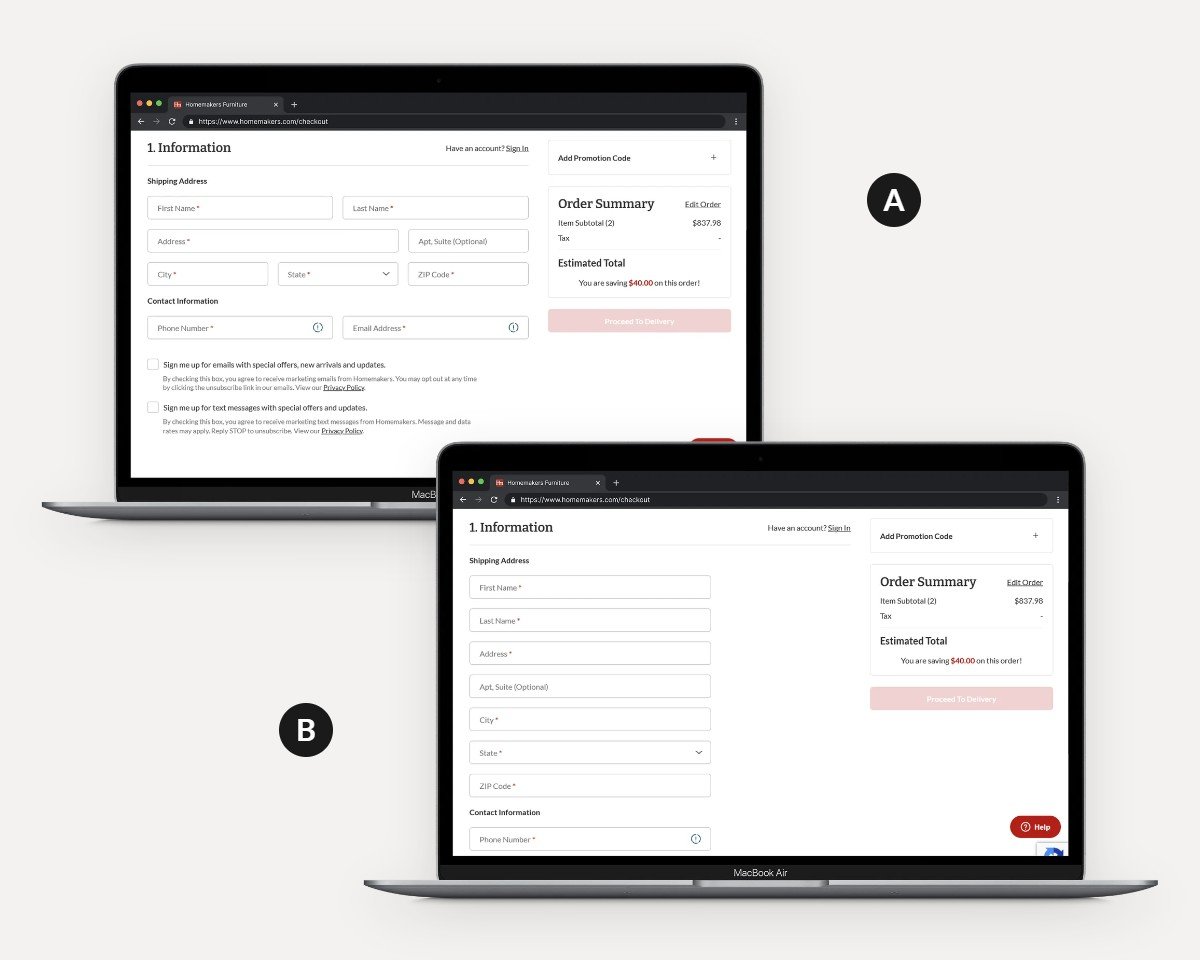
CRO summary slide: Single Column Form test hypothesis with multi-column and single-column checkout shipping forms
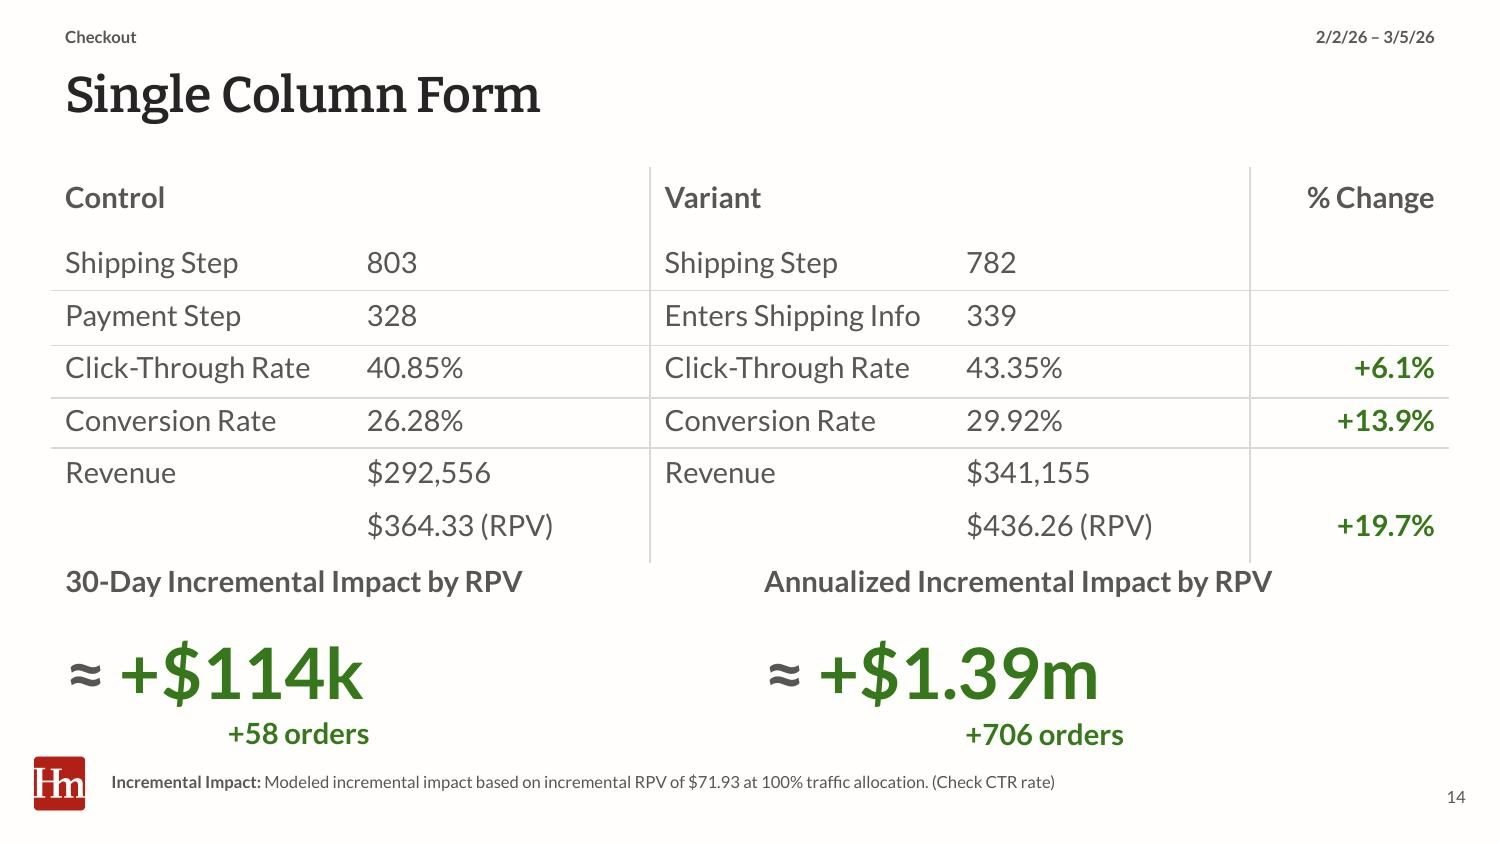
CRO summary slide: Single Column Form test results, about +$114k over 21 days and +$1.39M annualized
CRO summary section divider: Example of a failed test
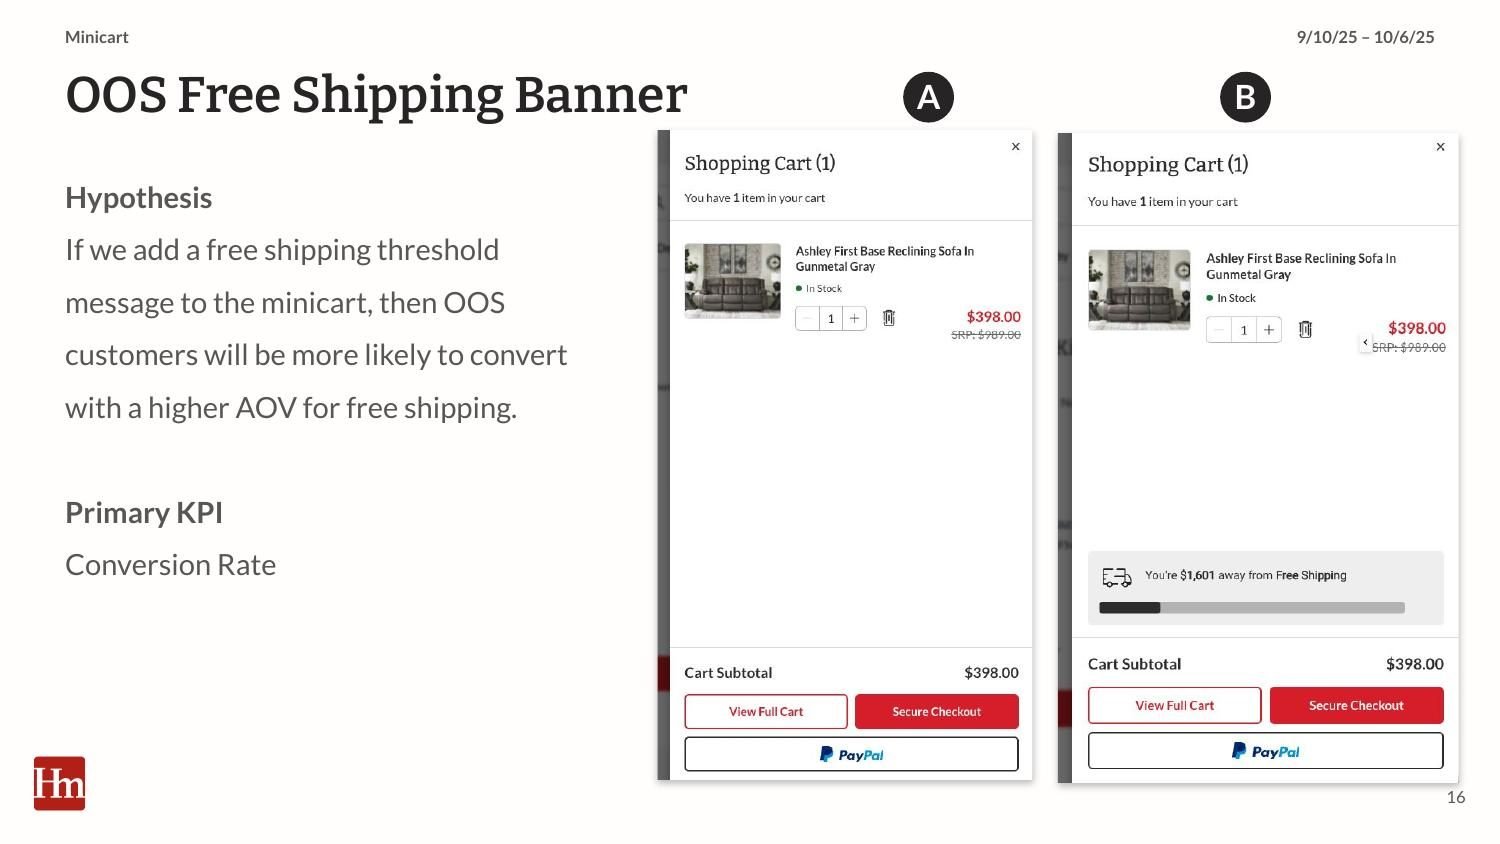
CRO summary slide: OOS Free Shipping Banner test hypothesis with control and variant product page screenshots
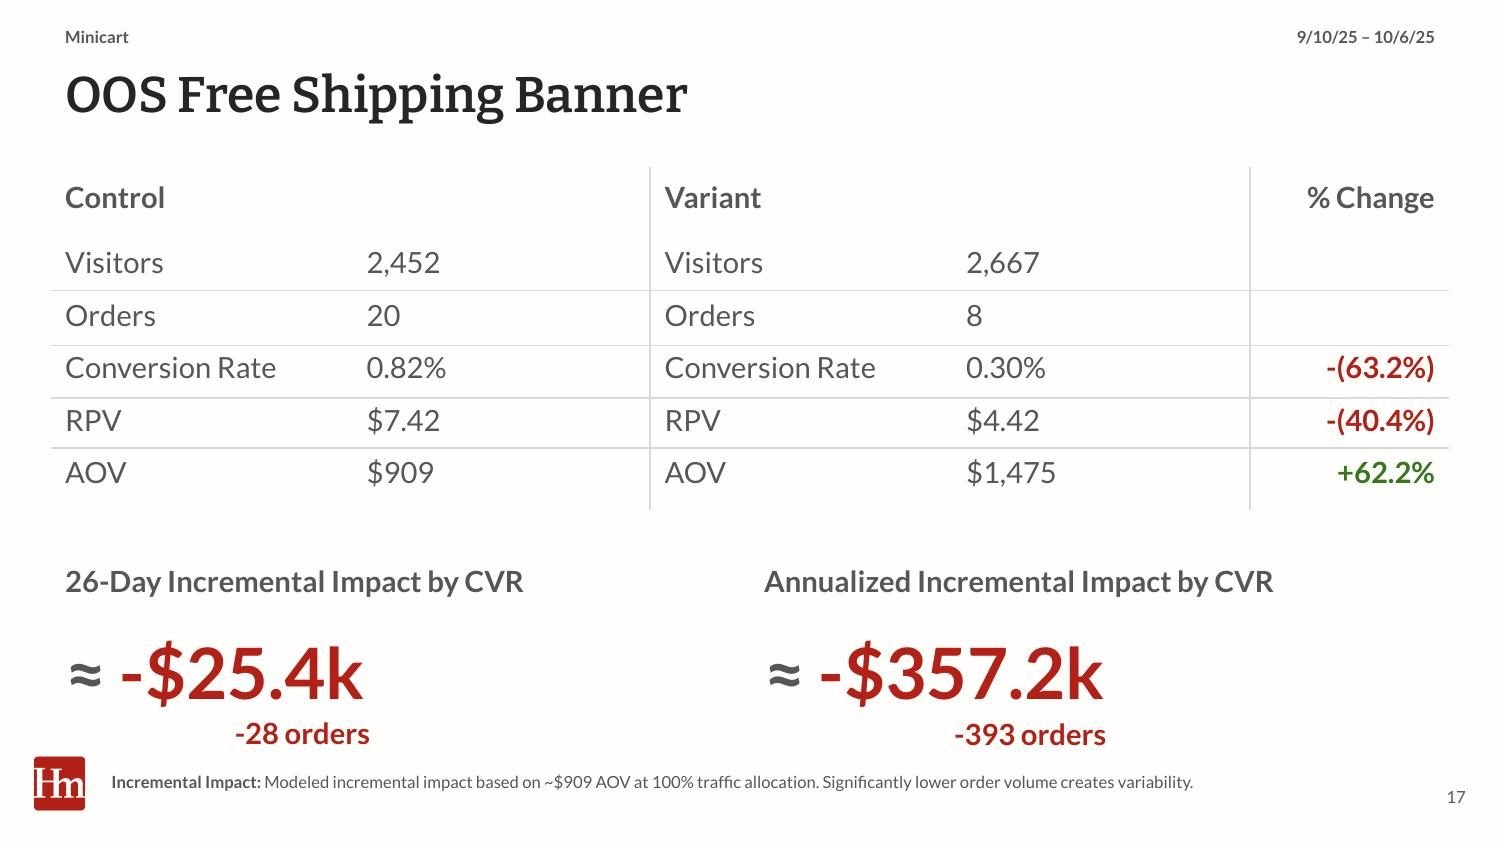
CRO summary slide: OOS Free Shipping Banner test results showing a negative impact of about -$25.4k over 21 days and -$357.2k annualized
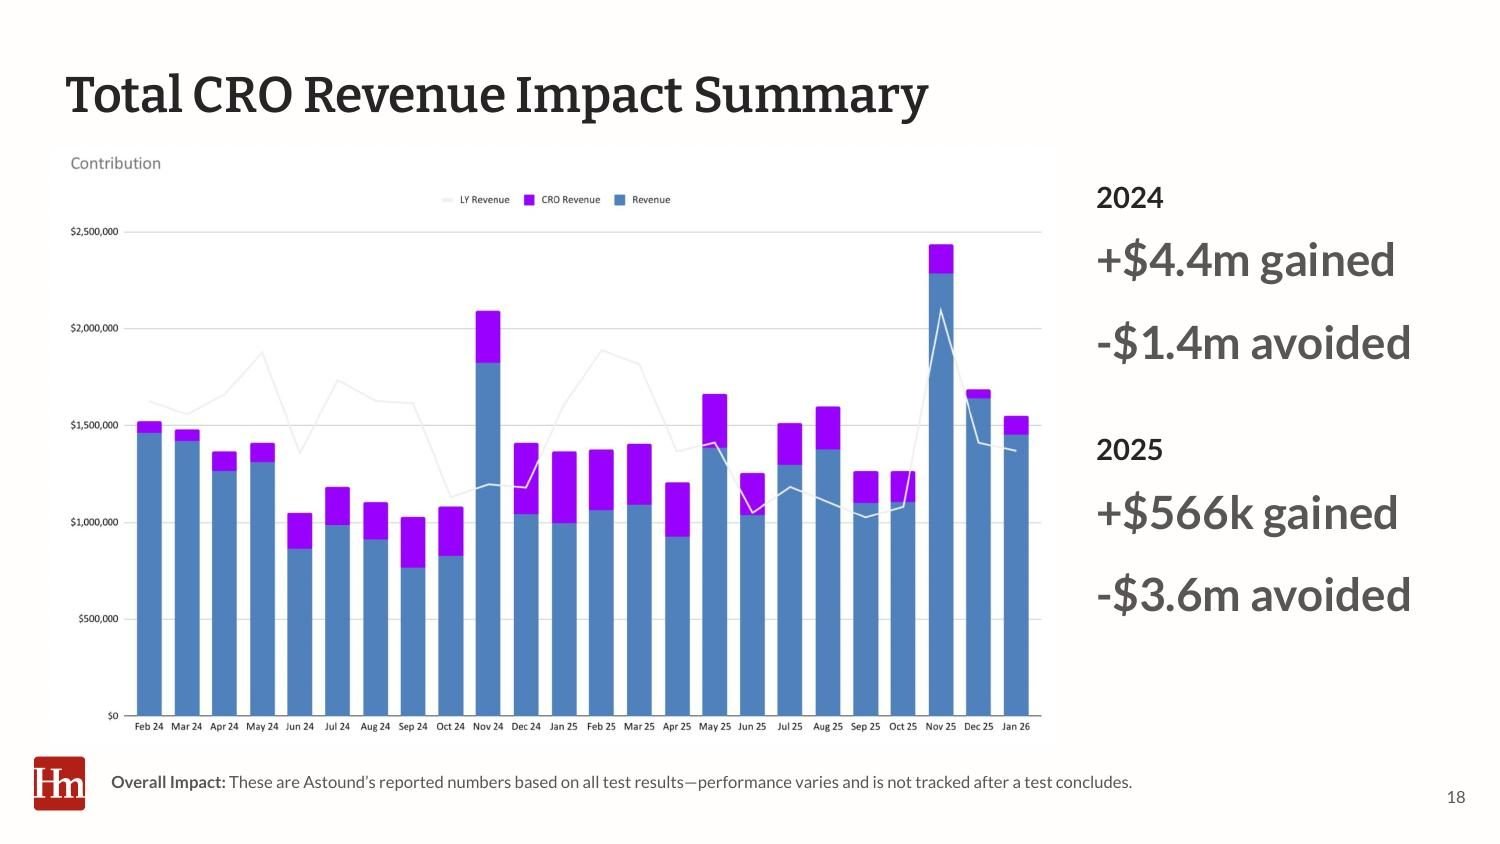
CRO summary slide: Total CRO revenue impact bar chart showing $4.4M gained and $1.4M avoided in 2024, and $566k gained and $3.6M avoided in 2025
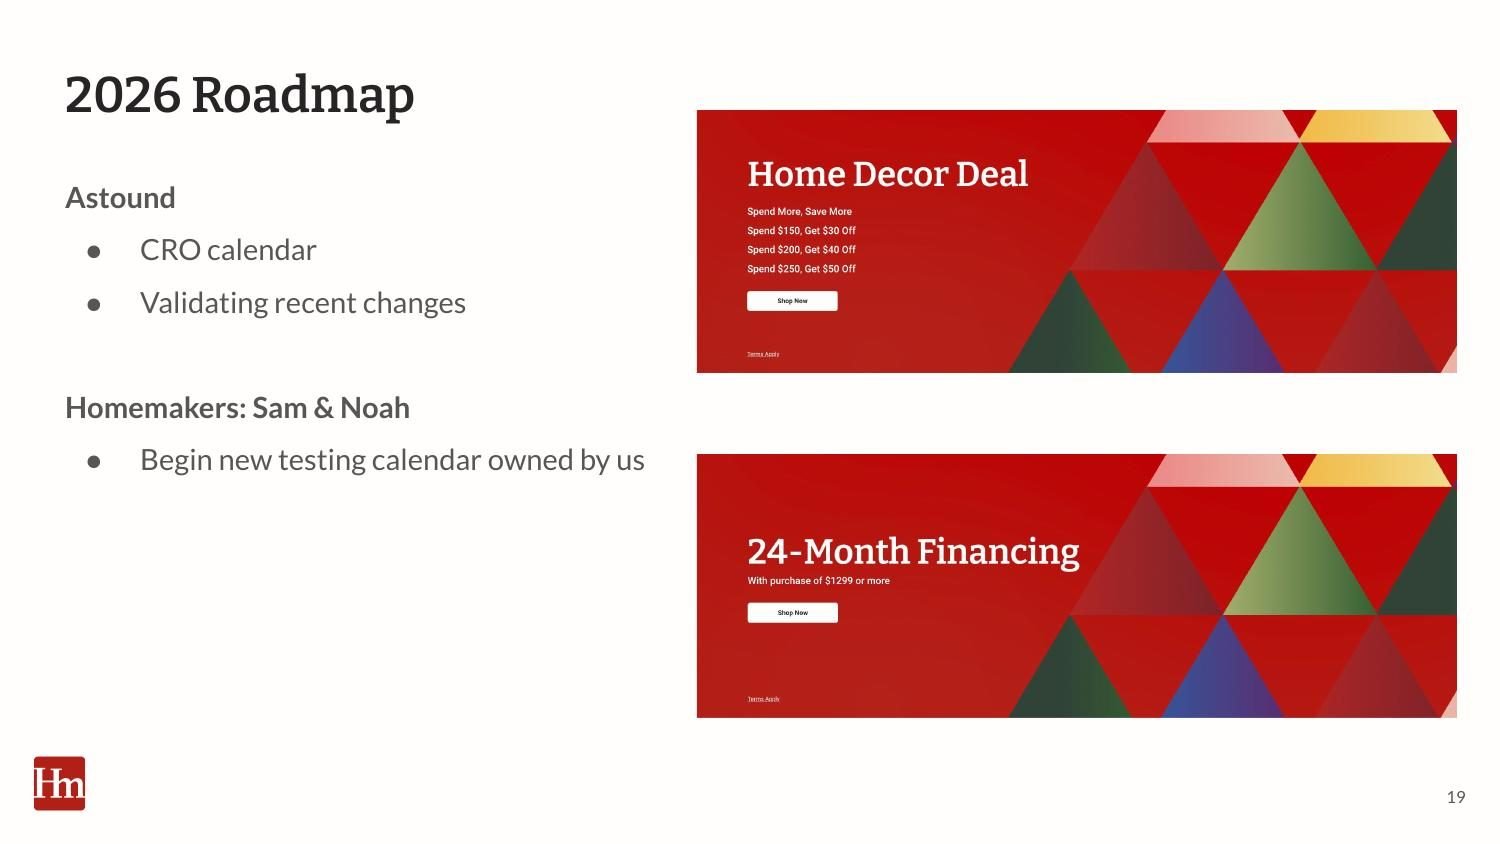
CRO summary slide: 2026 roadmap listing CRO planning and Homemakers test and hook ideas with promotional banner examples
CRO summary slide: Thank you, questions?

Explore the Tests

Dive deeper into three of the A/B tests. Each one has its own case study.
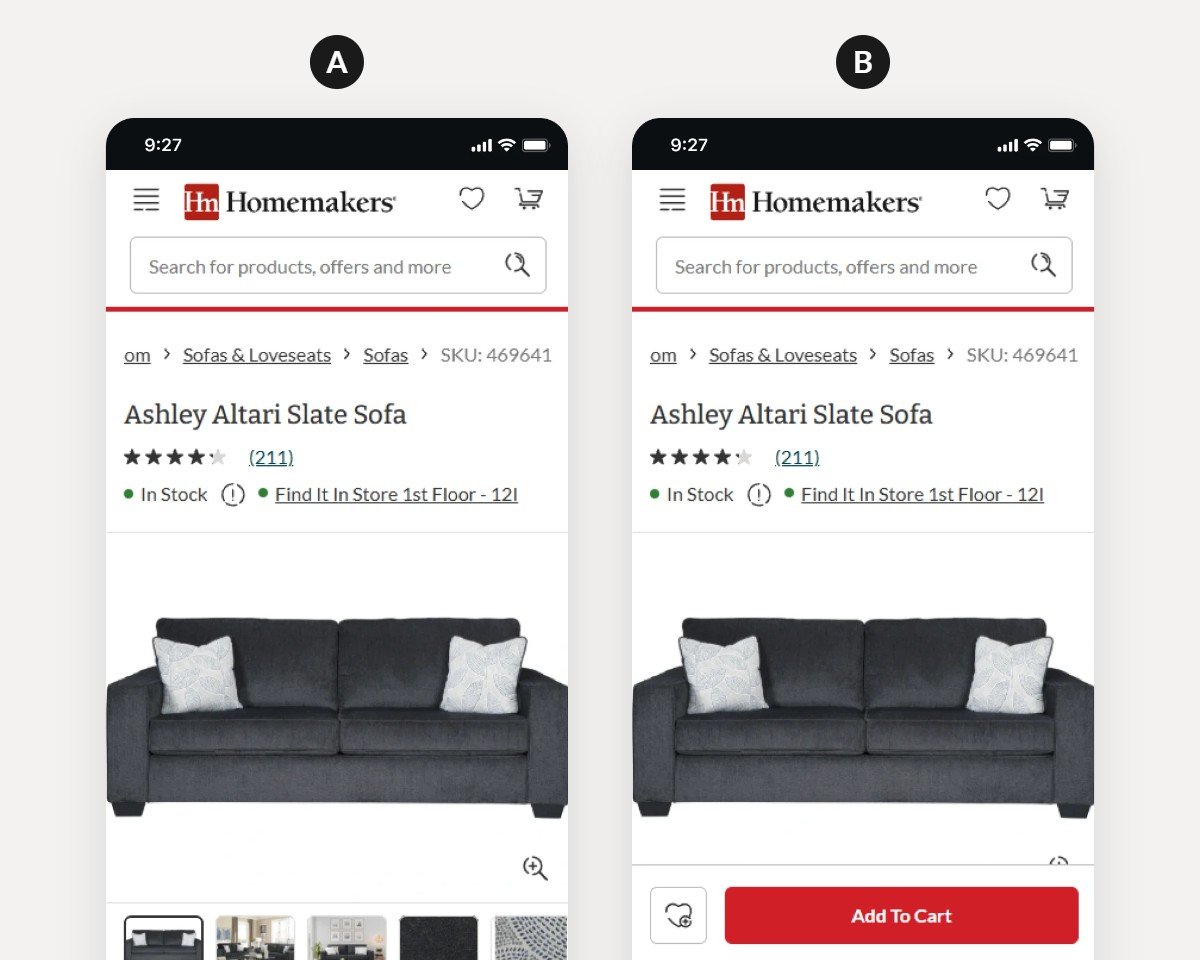
A/B test mockups: Persistent Add to Cart control vs. sticky Add to Cart variant on mobile PDP

Mobile PDP

Persistent Add to Cart

Keeping Add to Cart in view as shoppers scroll mobile product pages lifted add to cart clicks by 6% at 95% confidence.
+$141k

projected revenue during the 4-week test

View Case Study →

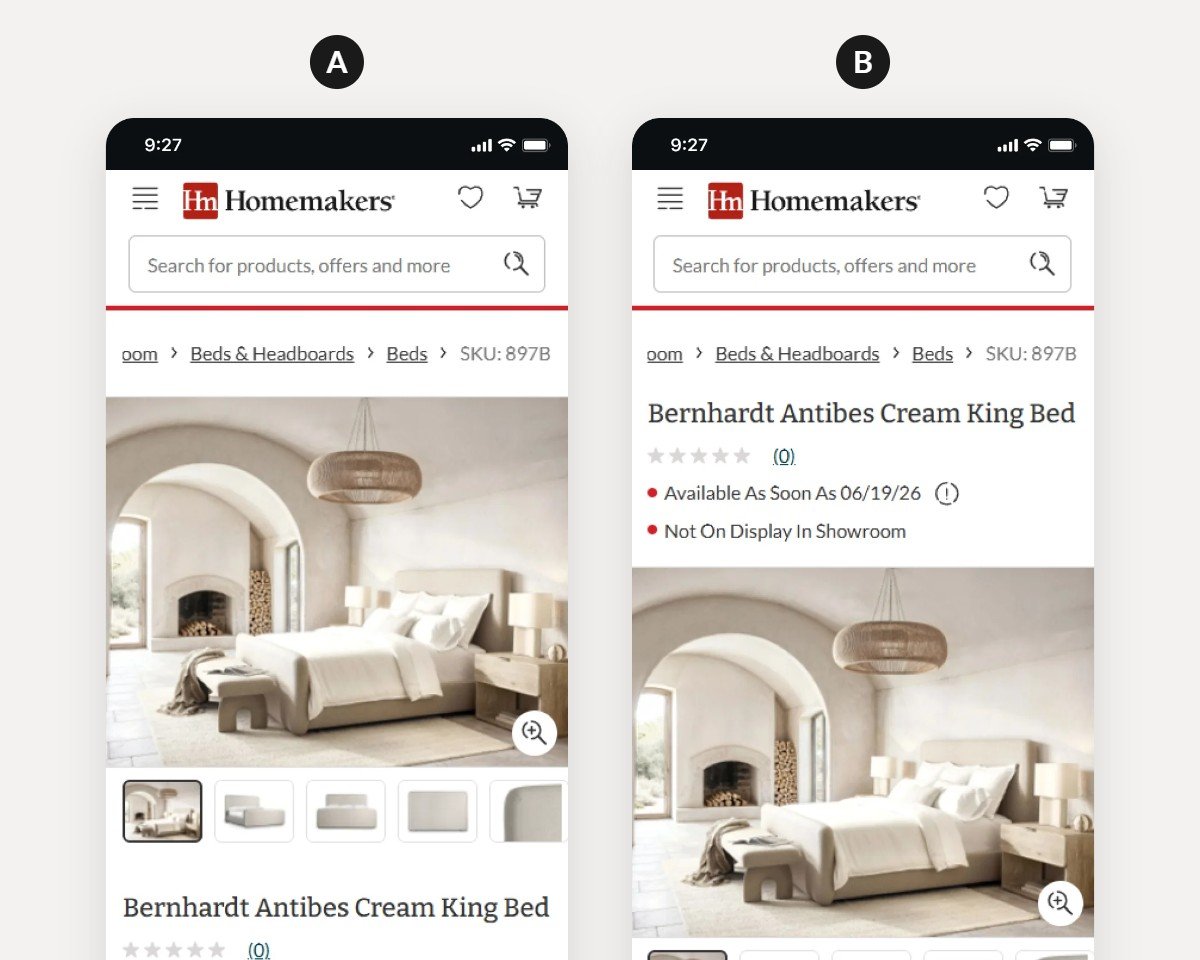
A/B test mockups: Buy block control vs. restructured buy block variant on mobile PDP

Mobile PDP

Buy Block Positioning

Restructuring the buy block to surface price and availability lifted add to cart clicks by 13.1% at 99% confidence.
+$1.05m

projected annual incremental revenue

View Case Study →

A/B test mockups: Multi-column vs. single-column checkout shipping form

Desktop Checkout

Single-Column Shipping Form

Moving step one of checkout to a single-column form lifted conversion rate by 13.88% at 94.7% confidence.

+$999k

projected annual incremental revenue

View Case Study →