A/B Testing: Optimizing Ecommerce Conversion Rates
Homemakers experienced a post-COVID surge in online sales, but when conversion rates plateaued, I initiated a CRO program to uncover friction points. I designed mockups and aided our CRO team to launch these A/B tests across key pages, using data to drive hypotheses and measure impact. The program has since delivered a 21:1 ROI and uncovered actionable insights that shaped future UX improvements.
Company
Homemakers Furniture
Role
UX Designer
Employment
Full-time
Period
Ongoing
Key Focus Areas
UX Design, A/B Testing, CRO Optimization
Primary Objective
Analyze and iterate on all critical areas of the ecommerce funnel at Homemakers to improve conversion and reduce drop-off using A/B testing and behavioral insights.
PDP — Buy Block
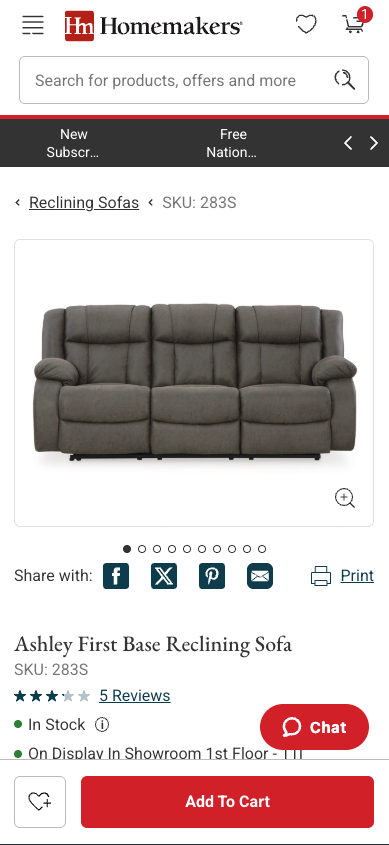
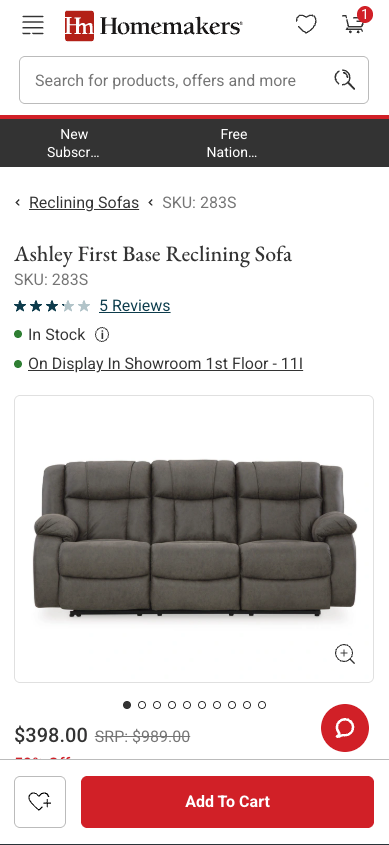
Hypothesis
If we adjust the location of key content including product name, reviews and stock availability above the main image on mobile, then there will be an improvement in the number of users that add to cart.
Results
- +13.1% Add to cart lift at 99% confidence
- Conversion rate and bounce rate remained relatively flat
- 24% of transactions had a shipping cost associated with the order
PDP — Sticky Add to Cart
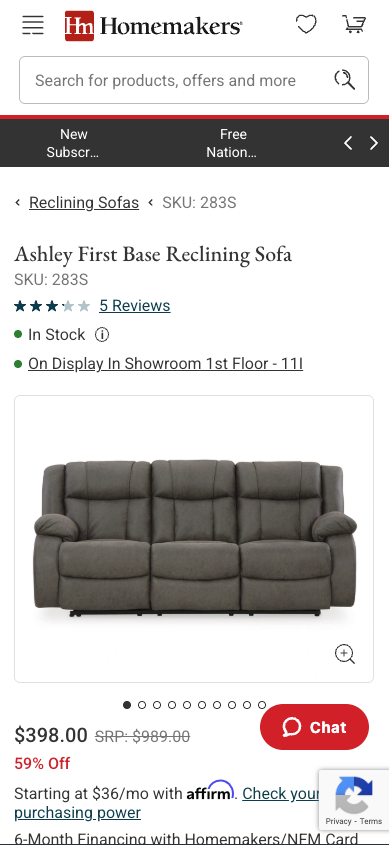
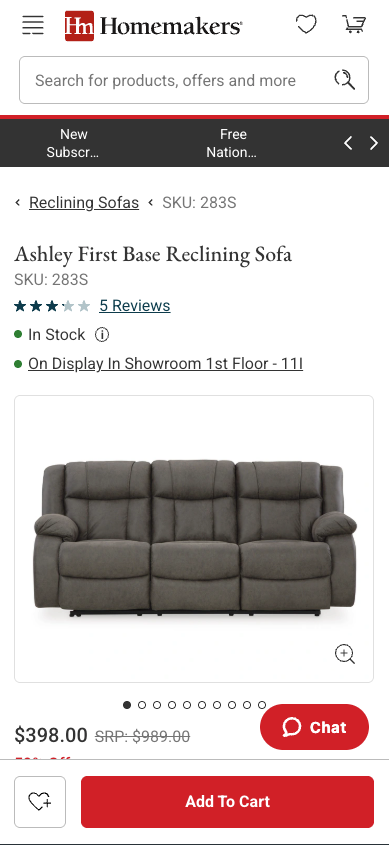
Hypothesis
If we make the add to cart CTA sticky on mobile PDPs, then customers will be more likely to add products to their cart because the ability to do so will be a consistent option on the page as they scroll through the details.
Results
- +6% Add to Cart lift at 95% confidence
- +48% Wishlist lift at 95% confidence
PLP — Free Shipping Message
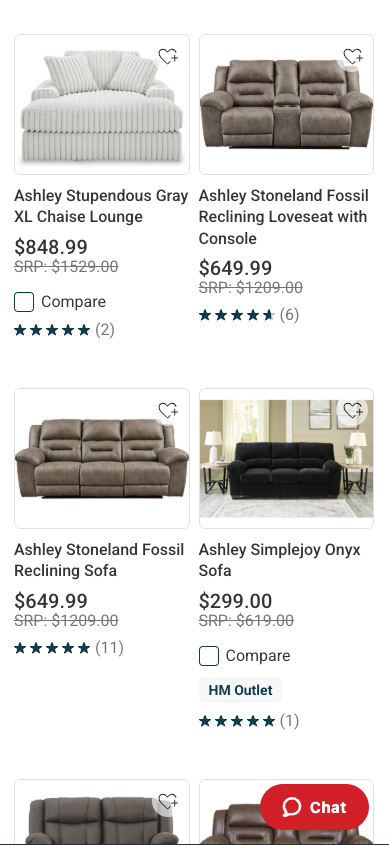
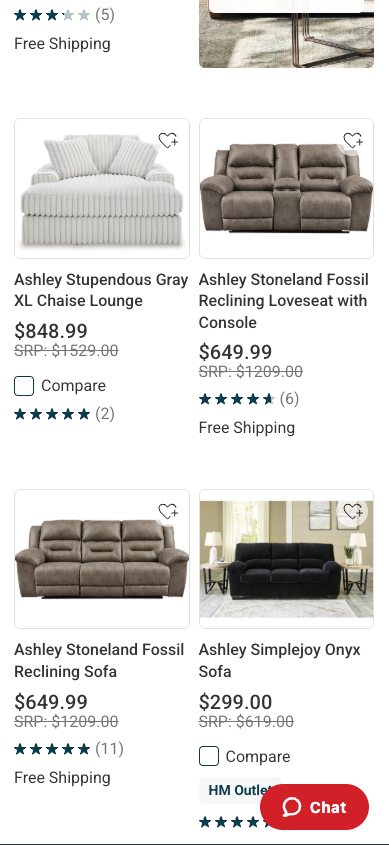
Hypothesis
If we add free shipping messaging to qualifying product tiles, then we will see an increase in customers viewing PDPs and adding to cart because the free shipping offer will incentivize customers to increase their average order value (AOV).
Results
- +3.53% Add to Cart lift at 84% confidence
- +1.5% Conversion rate not at confidence
Checkout — Shipping Step Fields
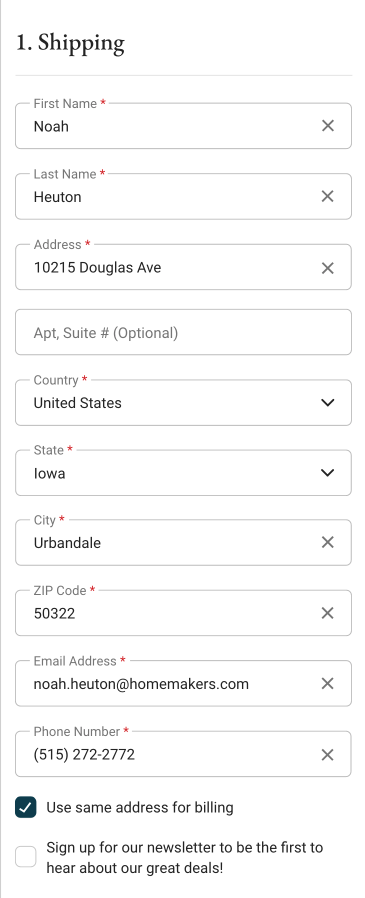
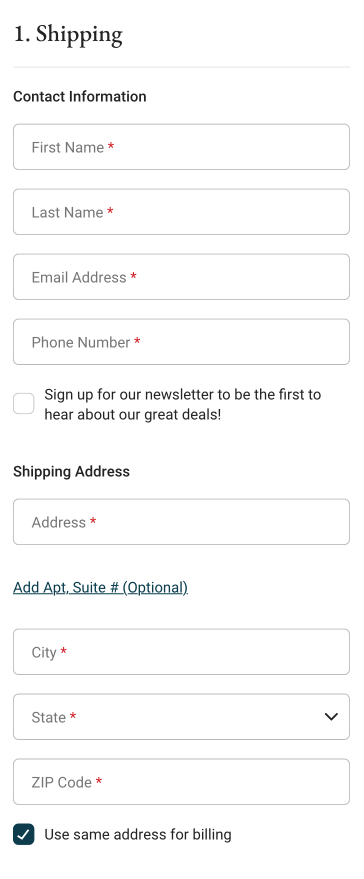
Hypothesis
If we reconfigure the form field layout in the shipping step of checkout, then customers should have a smoother checkout flow at this stage and move to the payment stage at a higher rate.
Results
- -1.49% Payment stage views
- -7.26% Conversion rate
Insights
- Drop-off rates must be caused by another issue on the page, check to make sure user journey is uninterrupted during checkout process
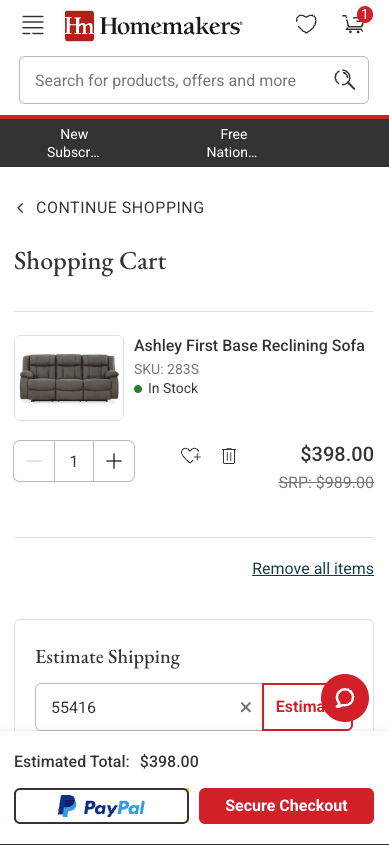
Minicart — Skip Minicart
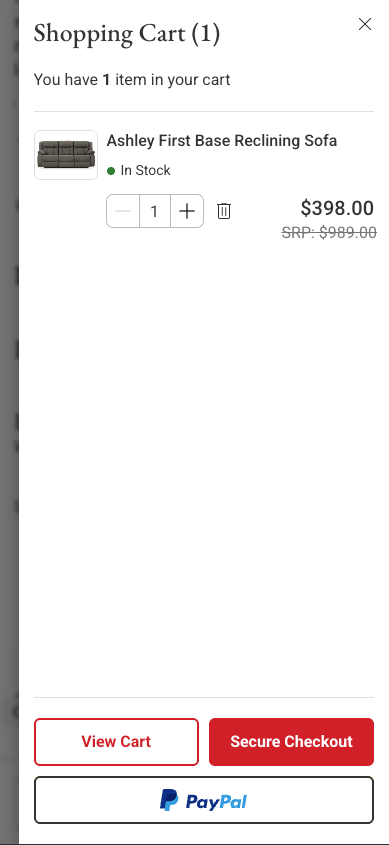
Hypothesis
If we hide the minicart and take customers directly to the cart page upon clicking the cart icon in the menu, we will see more customers purchasing because we will be removing an extra step from the funnel.
Results
- -10.85% Conversion rate
- Fewer customers moved through funnel and reverted back to control saving a potential loss
Insights
- Customers typically order ~2 items on average, but we hoped removing an extra step would increase transactions
- Possible that we unintentionally increased customer friction and reduced satisfaction if they expected a minicart instead of taking them away from the page they were on
Minicart — Shipping Banner
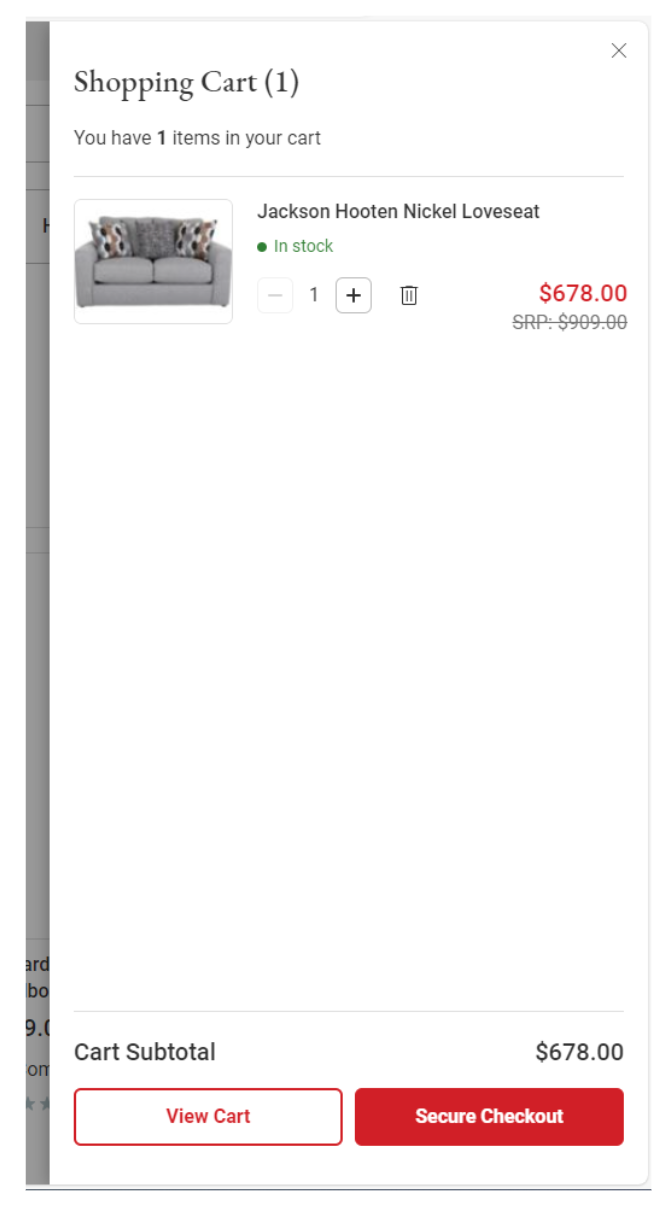
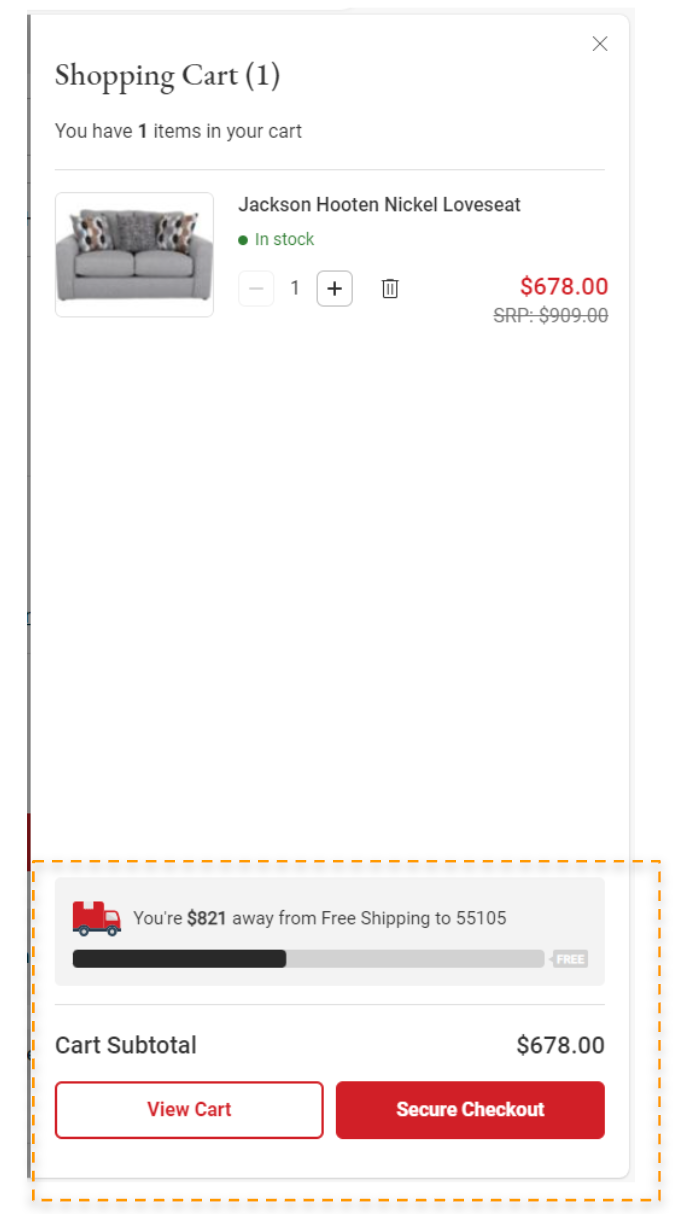
Hypothesis
If we add a free shipping threshold progress banner to the minicart, then customers will see that they have qualified for free shipping and as a result see an increase in the likelihood of a conversion taking place.
Results
- +10.57% Conversion rate lift
- +6.34% Cart page views
- +2.72% Average order value (AOV)
Insights
- Customers typically order ~2 items on average, but we hoped removing an extra step would increase transactions
- Possible that we unintentionally increased customer friction and reduced satisfaction if they expected a minicart instead of taking them away from the page they were on